



Share This Article
Key Points
- Victory Vistas, a tax-credit senior building in Paddock Hills, advertises a one-bedroom base rent of $1,154; Park Lane, a 1964 market-rate complex 734 feet away, lists a one-bedroom base rent of $1,105.
- Only 27 of the 948 units the Affordable Housing Leverage Fund financed in fiscal 2026, or 2.8%, carry 0% to 30% AMI restrictions, per Exchange calculations based on WVXU’s reported bands.
- Hamilton County’s four 2026 9% tax-credit awards represent $86.4 million in proposed development costs for 244 apartments, an Exchange-calculated weighted average of about $354,000 per unit, based on OHFA application summaries.
- OHFA’s 2026 60% AMI two-bedroom ceiling of $1,485 sits $273, or 22.5%, above the $1,212 median asking rent in an Exchange survey of 32 Westwood two-bedroom listings on Sept. 26, 2026.
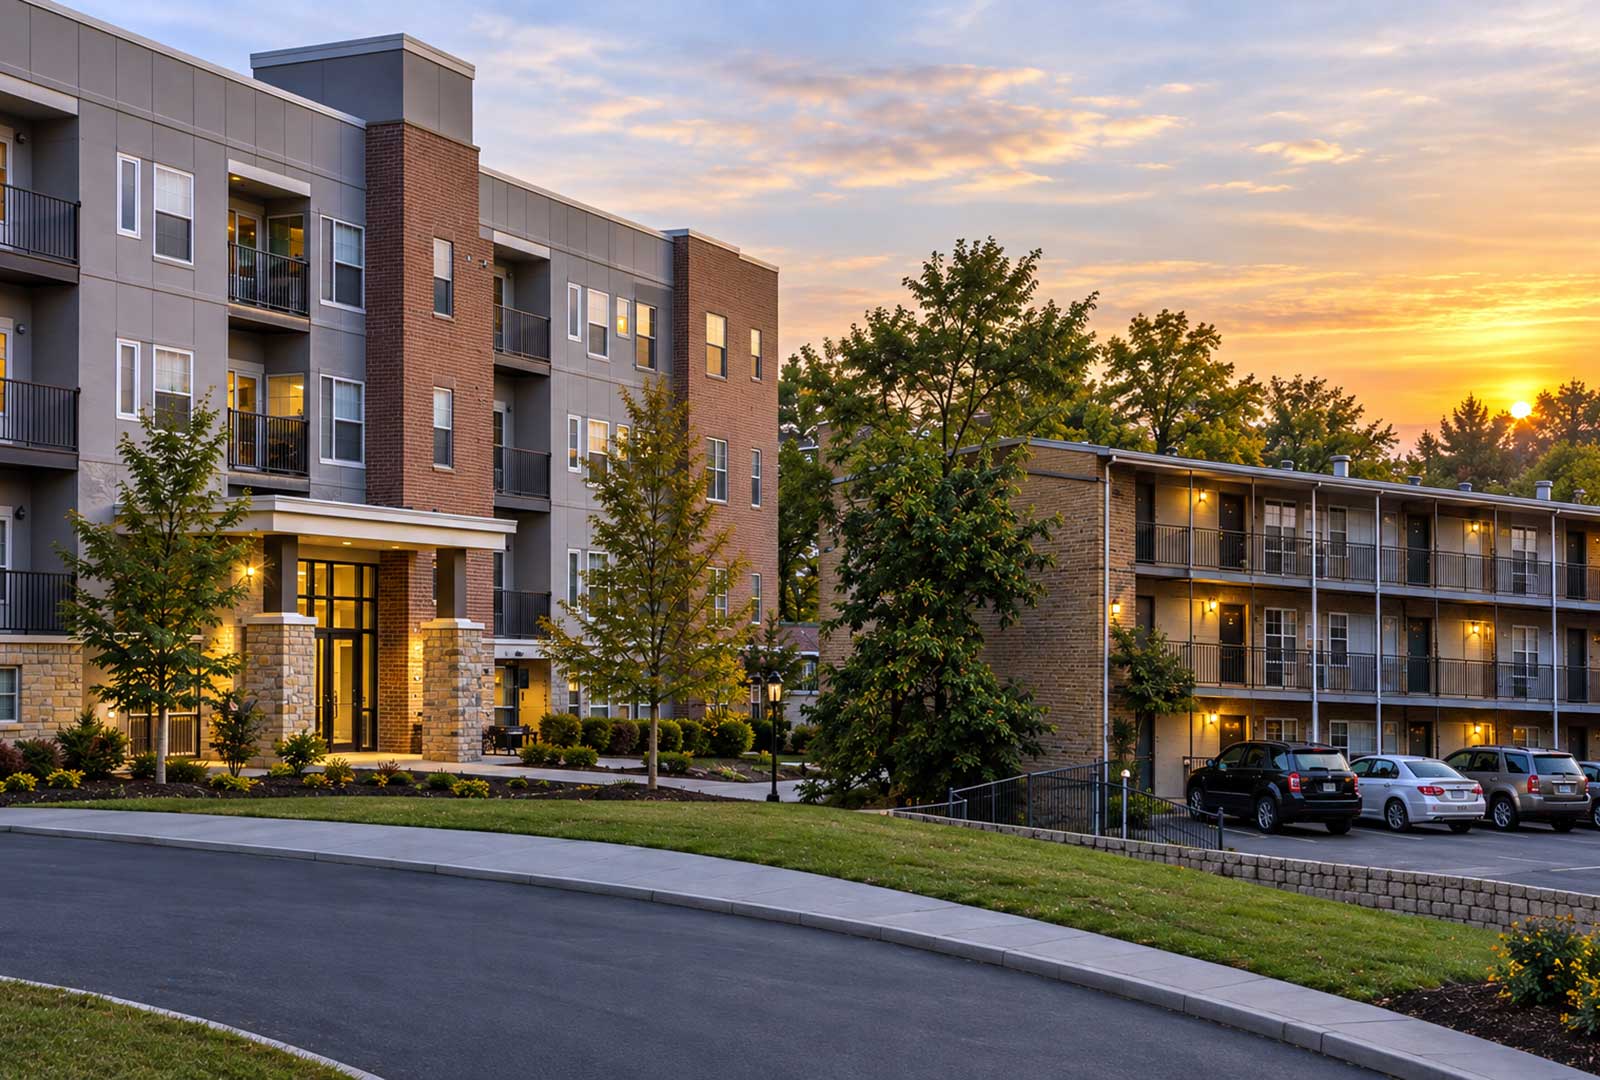
A subsidized senior apartment in Paddock Hills now advertises one-bedroom apartments starting at $1,154 per month.
The 1964 market-rate complex 734 feet up Victory Parkway lists a one-bedroom base rent of $1,105.
That pairing is the first entry in an Exchange test of whether Cincinnati LIHTC apartments rent for less than the surrounding market. I started pulling numbers after reading what happened in Portland, Oregon. Rents on income-restricted apartments there caught up with the rest of the city, and nearly 2,000 subsidized units sat empty. Cincinnati is not Portland. The numbers don’t support that claim, and I’m not going to make it. What they do support is a simpler question. After the tax credits, the city loan and the county money, is the “affordable” apartment actually cheaper than the one down the street?
How Portland affordable housing rents caught the market
ProPublica and Oregon Public Broadcasting reporter Tony Schick laid out the mechanism in June. Portland’s overall apartment vacancy stood at 7.6% in May, according to HFO Investment Real Estate, a Portland brokerage. Vacancy in the city’s income-restricted units ran about 11%. Nearly 2,000 of those units sat unused. In Gresham, a suburb, the tax-credit rent limit on a two-bedroom was $1,675. Zillow put a comparable market-rate unit at $1,525. Affordable operators told Schick they had raised marketing budgets to fill buildings the public paid to build. One offered a month of free rent.
Income verification and unit prep played a role in those vacancies, the story noted. Housing advocates said the biggest barrier was price. The Wall Street Journal followed on Sept. 25 with a story headlined “Portland Real Estate Is Such a Mess That All Housing Is Affordable Housing.” [NEEDS ADAM: WSJ URL and one confirmed detail from the text; the Exchange could not read the story directly.] Yardi Matrix’s 2025 competitiveness ranking of the 30 largest metros put Columbus among the markets where market-rate apartments already compete with fully affordable ones. Its public summary didn’t name Cincinnati.
The mechanism matters more than the headline. Market rents move with supply and demand. Tax-credit rent ceilings move with HUD’s income limits, which rise most years whether or not local rents do. Those two lines can run apart for a decade and then cross. Meanwhile, Oregon’s per-unit cost for subsidized housing nearly doubled to about $540,000, OPB reported on Sept. 17. That story covered lawmakers’ push to open the program’s financial records.
The Cincinnati Affordable Housing Test
Cincinnati reports how many affordable units it finances, at what income levels, and how many dollars went in. Nobody puts four numbers side by side for the same building. Those four are the restricted rent, the nearby market rent, the total cost per unit, and how far into poverty the income limits extend. So that’s the test. For every Cincinnati LIHTC project, the Exchange will try to fill in all four, starting with Victory Vistas and Westline Flats. The Portland problem shows up when the first number approaches the second, the third stays high, and the fourth never reaches the poorest households.
Three definitions, so the numbers travel with their meaning. Rent gap is the difference between the restricted rent and the median asking rent for the same bedroom count within about a mile. Deep affordability share means units reserved for households at or below 30% of area median income, divided by all restricted units. Cost per door means total development cost divided by total units. It is not the same thing as taxpayer cost.
Victory Vistas, 734 feet from the market
Victory Vistas opened in late 2024 at 4111 Victory Parkway with 50 apartments for residents 55 and older. Kingsley + Co. developed it with a 9% competitive housing credit awarded by the Ohio Housing Finance Agency in 2022. The city added a loan of up to $1 million from its fiscal 2023 affordable housing NOFA. Ten units carry 30% AMI restrictions and 40 carry 60% AMI restrictions, per OHFA’s application summary. That summary put total development cost at $13.2 million, or about $264,000 per unit. A 2023 zoning brief said $14.5 million, and WVXU reported $17 million last December. The Exchange found no primary document supporting the higher figure. So the per-door cost lands somewhere between $264,000 and $340,000.
Last fall, residents who had signed leases for around $500 or $600 received notices raising their rent to $1,154, WVXU and WCPO reported. Legal Aid counted increases as high as 130%. Mayor Aftab Pureval called it “potentially predatory” and said he was furious. Then OHFA told WVXU the new rents sat within the federal LIHTC limits. In February, Kingsley wrote that an administrative error had leased 11 extra units at roughly $600, the rate meant for the 10 deepest-affordability units. Vouchers arranged with the nonprofit SO-ACT and the housing authority covered those households. No rent ultimately went up, the company said. “No resident was displaced.”
Here’s the part nobody put next to a market listing. Beacon Property’s page for Victory Vistas now advertises one-bedrooms “starting at $1154” and two-bedrooms starting at $1,379. Water, sewer and trash come with the rent, and the listing puts electric at roughly $100 a month. Park Lane Apartments is a 150-unit Fath Properties complex built in 1964 at 4201 Victory Parkway. Its own site lists a 560-square-foot one-bedroom at a $1,105 base rent on a 12-month lease. For recurring charges the site doesn’t itemize, it shows a “total monthly leasing price” ranging from $1,139.10 to $1,164.10. The two addresses are 734 feet apart, according to the Exchange’s measurement from Census geocoder coordinates.
Park Lane is a nearby market-rate alternative, not a matched comparable. Its one-bedroom is smaller, the building is 60 years older, and its site doesn’t specify which utilities tenants pay for. It also advertises $115 off select two- and three-bedroom plans per month. So read this as a snapshot taken Sept. 26, not a lease-by-lease audit. Even so, the base rents are $1,154 and $1,105. The subsidized building is newer, bigger per unit, and has an elevator and a fitness center. It also asks $49 more in base rent. For 40 of the 50 apartments, public money bought a new building at the old building’s price. Not a lower price. That is the Gresham pattern at a Cincinnati LIHTC address, and it sat in plain view on two leasing websites.
What 60% AMI means under the 2026 LIHTC rent limits
The confusion at Victory Vistas came from a rule readers routinely get wrong. LIHTC rent is not 30% of the individual tenant’s income. Instead, OHFA sets a maximum gross rent from the income limit for an assumed household size. That ceiling includes a utility allowance for anything the tenant pays. For 2026, OHFA’s standard schedule for Hamilton County took effect May 1. It sets the 60% AMI income limit at $46,200 for one person and $65,940 for four. A two-person household qualifies at $52,800, about $100 under the city’s median household income.
| Unit size | 50% AMI max gross rent | 60% AMI max gross rent | 60% AMI, HERA Special |
|---|---|---|---|
| Studio | $962 | $1,155 | $1,174 |
| One-bedroom | $1,031 | $1,237 | $1,258 |
| Two-bedroom | $1,237 | $1,485 | $1,510 |
| Three-bedroom | $1,428 | $1,714 | $1,744 |
Source: OHFA, 2026 LIHTC Rent and Income Limits for 50% and 60%, Hamilton County rows. The HERA Special column applies only to qualifying properties, so the right table depends on the building. Victory Vistas’ $1,154 sits $83 under the standard one-bedroom ceiling. That is the kind of gap a utility allowance for tenant-paid electric would produce. The Exchange could not retrieve CMHA’s current allowance schedule to confirm it.
Who the Affordable Housing Leverage Fund is serving
The fourth number in the test is depth. Cincinnati’s poverty rate is 25.5% and its median household income is $52,909, per Census QuickFacts for 2020 through 2024. Hamilton County’s figures are 14.2% and $72,470. The city rate runs 11.3 points higher, or about 1.8 times the county’s. The city Health Department’s 2023 Community Health Assessment found the highest-poverty census tracts in Roll Hill, Lower Price Hill and the West End. Those tracts ran 73.1%, 69.4% and 66.9% on 2021 ACS data. They are tract figures, not neighborhood-wide rates.
Now set that against what the region’s main affordable-housing fund financed. The Cincinnati Development Fund manages the Affordable Housing Leverage Fund with city, county and private dollars. It financed 948 affordable units in the fiscal year that ended March 31, as reported by WVXU in April. By income band: 27 units at 0% to 30% AMI, 206 at 31% to 50%, 560 at 51% to 60% and 155 at 61% to 80%. The Exchange ran the shares. Deep-affordability units came to 2.8% of the total. Units at 51% to 60% AMI, the band where Victory Vistas’ rents live, came to 59.1%.
That 2.8% deserves a second look next to the city’s own funding criteria. Cincinnati’s 2019 Fair Housing Assessment states that the city “prioritizes funding for housing at 30% of Area Median Income” when selecting projects. The AHLF is not the city’s NOFA, and it draws on more than city money, so the two don’t have to match. Still, “low income” under the tax credit and deep poverty are different populations. Almost all of the fund’s output last year went to the first one. A three-person household earning the city median qualifies for the same 60% unit as a household in a Roll Hill tract where seven in 10 residents live in poverty.
The fund’s other averages need the same care. WVXU reported that the average cost per unit for multifamily and mixed-use projects topped $336,000. The average direct city or county subsidy was $27,526 per unit. Average AHLF financing reached $46,418 per unit once low-interest private loans count. The $46,418 is not taxpayer cash. The $336,000 is not either. CDF’s April 28 presentation to Council’s Housing and Growth Committee is the underlying record, and the Exchange has not yet retrieved it from Legistar. Until then, the 640-city, 308-suburban split that CityBeat and CET reported stays attributed to them.
How much a Cincinnati LIHTC apartment costs to build
OHFA’s application summaries give a cleaner cost picture than any press release. In May, OHFA awarded more than $39.1 million in annual 9% credits to 25 Ohio developments with 1,468 apartments. It received 62 applications requesting more than $98.4 million. Four of the 25 are Cincinnati LIHTC awards in Hamilton County. The Exchange pulled total development cost and unit count from each application.
| 2026 award | Neighborhood | Units | Total development cost | Cost per door | Pool |
|---|---|---|---|---|---|
| 2828 May Street II | Walnut Hills | 70 | $22,903,900 | $327,199 | New Affordability, General |
| 550 Reading | Pendleton | 60 | $21,319,027 | $355,317 | New Affordability, Senior |
| Fairview Magnolia | Over-the-Rhine, Fairmount | 56 | $20,961,401 | $374,311 | Preserved Affordability |
| June’s Place | Over-the-Rhine, Northside | 58 | $21,187,359 | $365,299 | CHDO set-aside |
Source: OHFA 2026 proposal summaries; Exchange calculation. Together the four proposals total $86.4 million for 244 apartments, a weighted average of about $354,000 per door. Those are application-stage figures that can move before closing. Fairview Magnolia is a rehab of 56 units in 10 scattered buildings, not new construction, and it still pencils at $374,000 a unit. Its lead developer is POAH Communities, also a partner in the Wesley Baymiller rehab. That is the operator whose 148 Cincinnati buildings went under a citywide inspection sweep last September after WCPO documented rats, sewage backups and broken doors. POAH told WCPO it was addressing the repairs and had invested in renovations.
The same filings show how deep the 2026 credits reach. Of the 244 units, 31 carry 30% AMI restrictions (12.7%). Eighteen of those sit in June’s Place, the CHDO project co-developed by Over-the-Rhine Community Housing. Fairview Magnolia restricts all 56 units to 60% AMI, and 39 units across 2828 May Street II and 550 Reading are limited to 70% AMI. That 12.7% is deeper than the leverage fund’s 2.8%, and it still leaves seven in eight new tax-credit units above the 30% line.
Why four awards when OHFA caps Hamilton County at two? The 2026-2027 Qualified Allocation Plan says the county limits “only apply to New Affordability” general occupancy and senior projects. June’s Place came through the CHDO sponsor set-aside, which the plan excludes from the cap. Fairview Magnolia came through the Preserved Affordability pool, which sits outside the cap’s scope. Only 2828 May Street II and 550 Reading counted against the two.
For context, federal law sets the 9% credit to deliver a credit stream worth 70% of a building’s qualified basis in present value. That is not 70% of total project cost. The noncompetitive 4% credit, paired with tax-exempt bonds, delivers equity worth “approximately 30-40% of the development’s total development cost,” per OHFA. Every remaining dollar comes from a mortgage, a local gap loan, a state loan, a deferred developer fee or a tax abatement. That is the stack. The public share varies from building to building, which is why the test has to run building by building.
Why the poorest census tracts pencil
One rule in that stack tilts toward high-poverty neighborhoods. Federal law lets a project in a Qualified Census Tract or Difficult Development Area claim eligible basis at 130%. That raises the credit a building can earn. HUD designates a QCT where at least half of households earn under 60% of area median income or the poverty rate reaches 25%. OHFA’s 2026 plan carries the same boost. Fairview Magnolia’s application notes it sits in both a QCT and a DDA.
That doesn’t mean the credit causes developers to build in poor neighborhoods. Land prices, zoning, available sites, community support and OHFA’s scoring all pull too. It does mean the financing rules can make a qualifying tract financially advantageous for a Cincinnati LIHTC deal. That deserves a place in the city’s concentration debate, which has been ongoing for two years.
The West End complaint and the concentration record
In May 2024, 10 West End residents filed a federal fair-housing complaint with HUD, WCPO reported. It alleges Cincinnati concentrated subsidized housing in predominantly Black neighborhoods. The complaint says the West End doubled its tax-credit units to about 1,750 between 2005 and 2021. Cincinnati neighborhoods that are at least 75% white held about 623 such units combined. HUD accepted the complaint for investigation on May 3, 2024. Accepting a complaint is not a finding, and the Exchange found no public update on its status.
Over-the-Rhine Community Housing pushed back hard. It called the complaint “particularly irresponsible” and argued it served pro-gentrification interests in a city short roughly 20,000 affordable units. WCPO’s own count sits between the two camps. Approved Hamilton County tax-credit projects totaled $184 million from 2020 to 2023. Eight of the 15 landed in tracts where less than half the population is white. Seven sat in tracts where at least half of households earn under $30,000. An Exchange analysis of HUD’s 2024 subsidized-housing data found 82.1% of the city’s combined tax-credit and HUD-assisted units in majority-minority tracts. One caveat: properties carrying both kinds of assistance count twice in that denominator.
Westline Flats: the next test
The building that gets the full test next is Westline Flats. Council voted 6-3 on Sept. 16 to rezone 2323 Ferguson Road in Westwood, the former Western Hills Sports Mall site. The plan calls for 167 apartments: 46 one-bedrooms, 95 two-bedrooms and 26 three-bedrooms. LDG Development of Louisville puts the cost at $57 million, or about $341,000 a unit, with income limits between 50% and 70% AMI. Councilmembers Kearney, Johnson and Walsh voted no. The Westwood Civic Association supported the project. The West Price Hill Community Council opposed it, citing concentrated poverty, traffic and crime, per WVXU.
LDG has said it will seek Low-Income Housing Tax Credits but did not submit Westline in the most recent cycle. So Westline is a proposed income-restricted project, not yet a Cincinnati LIHTC project, and no restricted rent exists. The ceilings do. Under OHFA’s 2026 standard schedule, a 60% two-bedroom tops out at $1,485 gross. A 70% unit, allowed under income averaging, scales to about $1,732 by the same formula.
The Exchange surveyed two-bedroom listings in the Westwood area on Apartments.com on Sept. 26. Apartments.com reported 115 results, and the 32 with posted rents ran from $725 to $2,100. Their median was $1,212. Four of the 32 asked $1,485 or more. Two asked $1,732 or more. Those listings include Cheviot and East Westwood addresses, older stock and single units in two-family houses. They are not a like-for-like match for a new elevator building. They are the market a 70% AMI two-bedroom would compete with. A utility allowance would bring the restricted rent below the ceiling. Even so, on this snapshot the 60% ceiling sits $273 above the neighborhood median, or 22.5% higher, and the 70% ceiling sits $520 above it.
How the Exchange calculated the Westwood market rent: on Sept. 26, 2026, the Exchange recorded every two-bedroom listing with a posted rent on Apartments.com’s Westwood results page. That produced 32 distinct addresses. The median uses the low end of each posted rent or range. Asking rent is what the figure reflects, not executed leases, and it does not adjust for utilities, fees or concessions unless the listing stated them. The full list appears at the end of the article, because these listings will disappear. As a cross-check, PadMapper put Westwood’s two-bedroom median at $1,100 as of Sept. 20, 2026, from 95 listings. Both figures sit well under the $1,485 ceiling.
Two more Exchange data points frame the site. HUD’s 2024 data show that Westwood has more voucher households than any other Cincinnati neighborhood, with roughly 1,050 reported. It holds only four tax-credit properties with 181 low-income units. Westline would nearly double the neighborhood’s tax-credit stock in the place already leading the city on vouchers. Its rent ceilings would start near the neighborhood’s market median and go up from there. Whether LDG prices below those ceilings is the number to watch.
One coalition, no outside scorecard
Every seat on Cincinnati City Council went to a Democratic-endorsed candidate in November 2025, in a formally nonpartisan race. Hamilton County’s three commissioners are Democrats: Stephanie Summerow Dumas, Alicia Reece and Denise Driehaus. The board has been all-Democratic since 2018. Summerow Dumas lost her May primary to Councilmember Meeka Owens, who faces Republican Jonathan Pearson in November. I’m not arguing that any of those officials wants poverty to persist, and no evidence supports that. I am arguing something narrower. When one coalition writes the housing budget at both City Hall and the county, the measurement has to come from outside.
The outcomes worth measuring are the ones in the test. Poverty concentration. Actual rent savings against the block. The deep-affordability share, cost per door, and maintenance after the ribbon cutting. A Council that voted 6-3 on Westline and a fund that financed 948 units can both answer those questions with records they already hold.
What the Exchange still needs
This is a first entry, not a verdict. The Victory Vistas comparison is based on two leasing websites reviewed on one day. A table of five to 10 Cincinnati LIHTC buildings needs more for each one. That means the LIHTC rent schedule and current asking rent, the utility allowance, any concessions, and three or more same-bedroom market listings within a mile. It also means total development cost, the credit allocation, city and county dollars, any AHLF loan, the abatement value and occupancy. Finally, it needs the number Portland had and Cincinnati doesn’t publish: the vacancy rate inside Hamilton County’s roughly 11,000 tax-credit units.
Cincinnati reports units financed, income tiers and dollars invested. It doesn’t put the subsidized rent next to the market rent down the street, the cost per unit and the depth of the income limit in one place. Portland found out what happens when those numbers drift apart. Before Cincinnati finances the next thousand affordable apartments, we should know whether the ones we’re already paying for are actually more affordable. On Victory Parkway, the subsidized one-bedroom’s base rent is $49 higher than the market one’s.
Appendix: Westwood two-bedroom listings, Sept. 26, 2026
Source: Apartments.com, Westwood two-bedroom results page, read Sept. 26, 2026. The rent shown is the low end of the posted rent range. The list leaves out listings with no posted rent. The Exchange did not verify availability or terms with any landlord.
| Property or address | ZIP | Asking rent | Square feet |
|---|---|---|---|
| Crossings at Cheviot, 3801 Dina Ter | 45211 | $1,185 | 810 |
| Pine Ridge, 2360-2396 Montana Ave | 45211 | $1,330 | |
| Montclair in the Woods, 3482 Hazelwood Ave | 45211 | $1,375 | |
| Vantage Pointe West, 2706 E Tower Dr | 45238 | $1,085 | |
| Overlook at Sunset, 1872 Sunset Ave | 45238 | $1,150 | |
| 2455 Montana Ave | 45211 | $1,275 | |
| The Park On Montana, 2872 Montana Ave | 45211 | $1,075 | |
| 3990 Yearling Ct | 45211 | $1,000 | |
| Panorama Apartments, 2375 Montana Ave | 45211 | $990 | |
| Westwood Garden, 3334-3338 Gerold Dr | 45238 | $780 | |
| Mayridge/Westbrook Apartments, 3183 Mayridge Ct | 45211 | $945 | |
| 3382-3388 McHenry Ave | 45225 | $895 | |
| Glenmore Building, 3641-3744 Harrison Ave | 45211 | $965 | |
| 3004 Glenmore Ave | 45238 | $1,550 | |
| 2905 Queen City Ave | 45238 | $1,350 | |
| 2845 Dunaway Ave | 45211 | $2,100 | |
| 2969-2971 Four Towers Dr | 45238 | $1,225 | |
| 2886 Temple Ave, Unit 1 | 45211 | $1,850 | |
| 3031 Irvella Pl | 45238 | $1,695 | 944 |
| 3053 N Hegry Cir, Unit 1 | 45238 | $1,250 | 954 |
| 2798 Queen City Ave, Unit 2798-2 | 45238 | $1,350 | 1,152 |
| 3001 Westwood Northern Blvd, 2-bed unit | 45211 | $1,050 | 800 |
| 3115 Bracken Woods Ln | 45211 | $1,250 | 900 |
| 3527 Werk Rd, Unit 12 | 45248 | $1,250 | 780 |
| 2910 Boudinot Ave, Unit 4 | 45238 | $1,100 | 800 |
| 3036 Urwiler Ave, Unit 2 | 45211 | $1,290 | |
| Westwood Northern Quad, 2580 Westwood Northern Blvd | 45211 | $975 | 900 |
| 3632 Westwood Northern Blvd | 45211 | $1,195 | 756 |
| 3800 Dina Terrace, Unit 3803-1 | 45211 | $1,199 | 800 |
| 4846 Prosperity Pl, Unit 2 | 45238 | $1,350 | 915 |
| 3121 Gobel Ave | 45211 | $725 | |
| 2555 Talbott Ave | 45211 | $1,300 | 913 |
FAQs
What is the LIHTC rent limit in Hamilton County in 2026?
OHFA’s standard 2026 schedule for Hamilton County, effective May 1, caps gross rent at 60% of area median income at $1,155 for a studio, $1,237 for a one-bedroom, $1,485 for a two-bedroom and $1,714 for a three-bedroom. Those ceilings include a utility allowance, and a separate HERA Special schedule runs slightly higher for qualifying properties.
Does affordable housing mean a tenant pays 30% of their own income?
Not under the Low-Income Housing Tax Credit. OHFA sets a maximum rent from the income limit for an assumed household size, not from what any tenant actually earns. A resident earning far below the limit still owes the full restricted rent unless a voucher or another subsidy covers the difference, as happened at Victory Vistas.
How much does an affordable apartment cost to build in Cincinnati?
OHFA application summaries for Hamilton County’s four 2026 9% awards show $327,000 to $374,000 per unit, a weighted average of about $354,000 by Exchange calculation. WVXU reported the Affordable Housing Leverage Fund’s multifamily average topped $336,000 per unit in fiscal 2026. Total development cost is not taxpayer cost; the public share varies by building.
Why are tax-credit projects often built in high-poverty neighborhoods?
Federal law lets projects in Qualified Census Tracts or Difficult Development Areas claim eligible basis at 130%, which raises the credit a building can earn. HUD designates a QCT where at least half of households earn under 60% of area median income or poverty reaches 25%. Land cost, zoning, sites and OHFA scoring also shape where projects land.
Could a Cincinnati affordable apartment cost more than a market-rate apartment?
Yes, at the ceiling, and in one case at the listing. In Westwood, OHFA’s 60% AMI two-bedroom limit of $1,485 sits 22.5% above the $1,212 median asking rent the Exchange found in 32 listings on Sept. 26. In Paddock Hills, Victory Vistas’ $1,154 one-bedroom base rent is $49 above Park Lane’s, 734 feet away.
The Cincinnati Exchange’s proprietary AI article system assisted with research, verification and drafting. A human editor reviewed and approved the article before publication. This article includes analysis and opinion from the author. Factual claims are sourced in the text. The West End fair-housing complaint contains allegations that HUD accepted for investigation but has not adjudicated. Tenant complaints about POAH properties and Legal Aid’s claims regarding Victory Vistas are allegations reported by WCPO and WVXU; no court or agency has ruled on them.