



Share This Article
Key Points
- Since 2014, Ohio polls missed the Republican’s margin by about 5 points on average.
- The 3.5-point miss toward Democrats holds for presidential years, not midterms.
- Final-week polls bunch together more than chance predicts but still miss together.
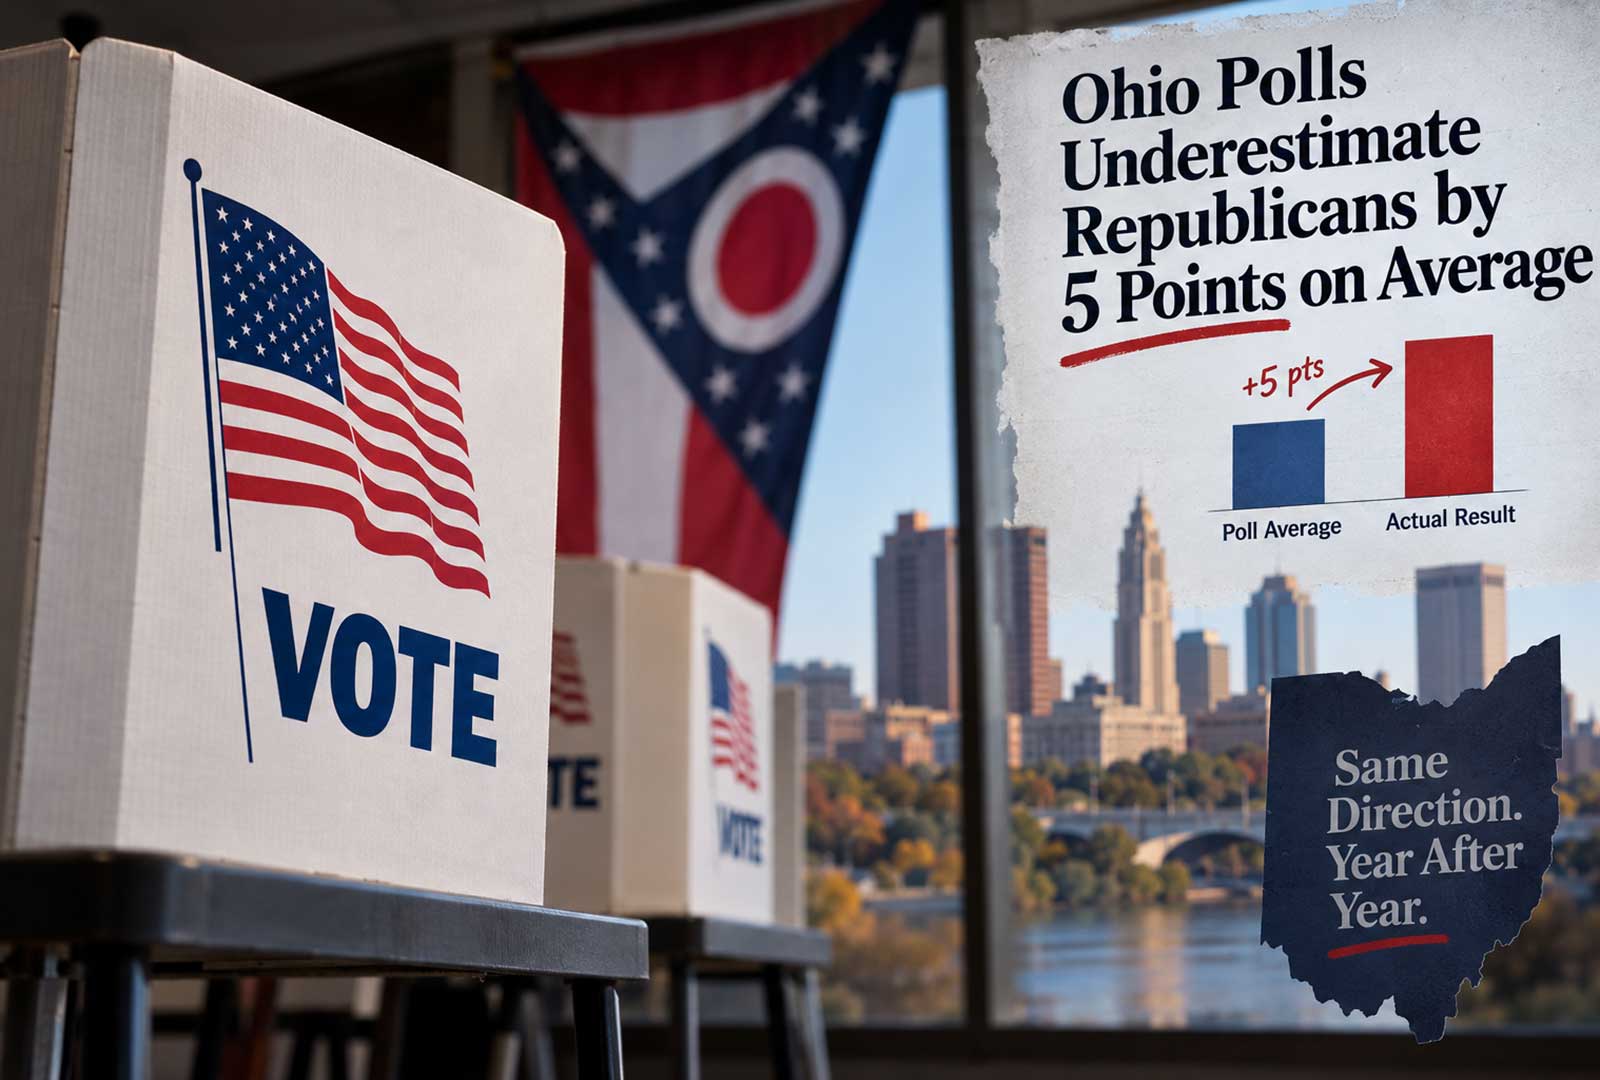
Political polls are mostly not fake, but Ohio polls have underestimated Republicans by about 5 points on average since 2014, according to Exchange’s calculations. Brown leads Husted by 3.1 points in RealClearPolling’s average, though past misses don’t reliably predict the next one.
By the Exchange’s count, Ohio polls have underestimated Republicans by an average of 5 points since 2014.
This fall, those polls show Democrat Sherrod Brown leading Republican Sen. Jon Husted by about 3 points.
So are Ohio polls fake, or just wrong in the same direction, year after year? The honest answer is the second one, and it’s more interesting than fraud. The Exchange checked 10 races for president, Senate and governor, using FiveThirtyEight’s poll archive and RealClearPolling. All 10 poll averages underestimated the Republican, though RealClearPolling’s own 2022 Senate average ran the other way. The miss shrank to about 2 points in 2024. With Brown-Husted and Acton-Ramaswamy on the Nov. 3 ballot, that track record matters more than any single poll.
What Fake Polls Actually Look Like
Fake polls do exist, and they’re worth knowing about. In 2010, the liberal site Daily Kos sued its own pollster, Research 2000, saying the data it bought was “almost certainly falsified,” Research-Live reported. One tell: men’s and women’s results came out both odd or both even on 776 of 778 questions. This August, a company called Median Strategies retracted polls on races in Wisconsin, Nevada and Los Angeles, the AP reported. The company called itself “a short-term social experiment” testing how purported polling information could spread “without independent verification.”
Then there’s junk data inside real polls. Cheap opt-in online panels pay people to click through surveys, and some don’t bother telling the truth. In one opt-in poll, “12% of adults under 30” claimed they held a license to operate a nuclear submarine, the Pew Research Center found. The real share rounds to zero. Those problems are real. But they don’t explain Ohio, where established pollsters keep missing in the same direction.
How Far Off Ohio Polls Have Been
Here’s the record. For 2014 through 2022, the Exchange averaged every Ohio poll in FiveThirtyEight’s public archive taken in the final 21 days of each race. Each poll counts equally, so a firm that polled twice counts twice. FiveThirtyEight’s archive doesn’t cover 2024, so those rows use RealClearPolling’s final averages. Actual margins come from FiveThirtyEight’s archive and, for 2024, the Ohio Secretary of State’s certified results.
| Race | Final-weeks poll average | Actual result | Miss toward the Democrat |
|---|---|---|---|
| 2014 governor (3 polls) | Kasich +20.7 | Kasich +30.6 | 9.9 |
| 2016 president (21 polls) | Trump +1.7 | Trump +8.1 | 6.5 |
| 2016 Senate (12 polls) | Portman +14.3 | Portman +20.9 | 6.6 |
| 2018 governor (7 polls) | Cordray +2.3 | DeWine +3.7 | 6.0 |
| 2018 Senate (6 polls) | Brown +11.5 | Brown +6.9 | 4.6 |
| 2020 president (18 polls) | Trump +2.1 | Trump +8.0 | 6.0 |
| 2022 governor (13 polls) | DeWine +19.8 | DeWine +25.0 | 5.2 |
| 2022 Senate (13 polls) | Vance +4.7 | Vance +6.1 | 1.4 |
| 2024 president (RCP) | Trump +9.3 | Trump +11.2 | 1.9 |
| 2024 Senate (RCP) | Moreno +1.7 | Moreno +3.6 | 1.9 |
Ten races, ten misses in the same direction, averaging 5 points. That streak holds under the Exchange’s method, not every method. RealClearPolling picks its own polls and cutoffs, and its 2022 Senate average had Vance up 8, which overstated him. The Exchange also reran its numbers counting only each firm’s last poll. All 10 races still lean the same way, with an average miss of 4.6 points. Still, the pattern is hard to wave away.
It wasn’t always this way. From 1998 through 2012, Ohio polling averages missed in both directions and overstated Republicans in 10 of 14 races, the same archive shows. Cincinnati even had its own example. The University of Cincinnati’s Ohio Poll shows up in the archive from 1998 through 2012. In the final two months, it overstated the Republican in 13 of the 14 races it polled, by about 4 points on average across 52 polls.
The 3.5-Point Claim Checks Out, for Presidential Years
You may have heard that polls overstate Democrats by about 3.5 points. That’s close for presidential election years, counting every office on the ballot. The American Association for Public Opinion Research, the field’s professional body, found polls in the final two weeks “overstated Democratic margins by 2.7 points across all offices” in 2024. That was “smaller than the 4.6-point overestimate in 2020 and 3.1 points in 2016,” its task force wrote. Average those three and you get 3.5. “For the third straight presidential cycle, pre-election polls underestimated Republican vote shares relative to Democrats’,” the group concluded.
Midterms tell a different story, though. The same AAPOR summary found polls “overestimated Republicans by only 0.6 points in 2022 and Democrats by only 0.1 points in 2018.” In 2012, polls underestimated Barack Obama. And last November, polls badly underestimated Democrats in New Jersey. RealClearPolling’s final average had Mikie Sherrill up 3.3 points, and she won by about 14, according to New Jersey’s certified results. So the polling error is real, but it doesn’t always run toward Democrats.
Are Pollsters Mostly Democrats?
The Exchange found no study showing most pollsters are Democrats. What the data does show is who sponsors polls. In FiveThirtyEight’s archive, more than 80% of polls in every even-year election from 1998 through 2022 carry no party or campaign sponsor, though FiveThirtyEight cautions its sponsor labels aren’t always consistent. Among the ones that do, Democratic-sponsored polls outnumbered Republican ones from 2004 through 2020. That flipped in 2022, when the archive counts 131 Republican-sponsored polls to 79 Democratic ones.
Partisan polls do lean toward their sponsors. In the final three weeks, Democratic-sponsored polls overstated Democrats by 3.9 points on average, and Republican-sponsored polls overstated Republicans by 3.1, by Exchange calculation. But that’s not what sank 2016 and 2020. Polls with no partisan sponsor overstated Democrats by 3.7 points in 2016 and 4.6 in 2020. Many big media polls also use bipartisan teams. Fox News polls, for example, run “under the joint direction of Beacon Research (D) and Shaw & Company Research (R),” according to Fox News.
Do Polls Tighten Right Before the Election?
Final-week polls do bunch together, more than chance alone would explain. The Exchange tested it with FiveThirtyEight’s presidential, Senate and governor polls from 1998 through 2022. Each poll’s sample size predicts how far polls of the same race should scatter from sampling error alone. Two months out, real polls scattered a little more than that. In the final week, though, they scattered less in 72% of the 177 races with at least five final-week polls.
How unusual is that? Small groups of polls can look tight by luck, so the Exchange simulated pure sampling error for each race’s actual number of polls. Chance alone produced a share near 58%, and rarely above 65%. The gap held when the Exchange counted each pollster only once per race, which removes repeat tracking polls. The test treats every poll as an independent random sample. Real polls aren’t, and pollsters weighting to the same targets can shrink the spread without copying anyone.
Here’s the catch. Bunching up didn’t make them right. Take the 257 races from 2014 through 2022 with polls in all three time windows. Polls taken three weeks to two months out overstated Democrats by 3.7 points. Final-week polls still overstated them by 3 points, by Exchange calculation. Polls tightened together and missed together.
Poll Herding or Shared Methods?
Pollsters call one possible cause herding. A pollster sees a result far from everyone else’s and adjusts it toward the pack, so nobody looks too wrong alone. The Exchange’s test shows the clustering, not the reason for it. Nate Silver found the same bunching in 2024’s swing states, where 193 of 249 October polls landed within 2.5 points, against 55% expected by chance in a tied race. His Silver Bulletin analysis put those odds at “1 in 9.5 trillion.”
AAPOR’s task force sees it differently. It found low variability in 2024 but said “this does not appear to be a result of herding.” Instead, “a broader reliance on political variables for sampling and weighting likely reduced spread,” the task force wrote. Either way, a tight cluster tells you pollsters agree. It doesn’t tell you they’re right.
Why Ohio Polls Keep Missing
No one has pinned down a single cause. After 2020, AAPOR ruled out several popular theories. The error “was not caused by late-deciding voters voting for Republican candidates,” and it wasn’t caused by “a failure to weight by education,” the 2020 report said. Nor was it “primarily caused by respondents’ reluctance to tell interviewers they supported Trump.” Instead, the report floated a theory about who answers. “Self-identified Republicans who choose to respond to polls are more likely to support Democrats,” it said, if Trump’s strongest supporters were the least likely to take part. The task force also conceded the idea “cannot be directly evaluated without knowing how nonresponders voted.”
If that theory holds, it would hit Ohio polls harder than most, because the voters least likely to respond would be the ones who’ve moved Ohio right over the past decade. Pollsters have since leaned more on political variables, and “public polls were more accurate in 2024 than in 2020 and 2016,” AAPOR’s 2024 summary said. Whether that fixed Ohio’s problem is exactly what this November will test.
What Ohio Polls Show for Brown and Husted
RealClearPolling’s average of 12 Ohio polls taken Sept. 1 through Oct. 6 has Brown at 47.3% and Husted at 44.2%, a 3.1-point lead. Results range from Husted up 1 in a co/efficient poll to Brown up 8 in a Marist poll of registered voters. The NYT/Siena and Suffolk polls, both near the top of FiveThirtyEight’s last pollster ratings, show Brown up 3. In the governor’s race, the average of eight polls has Amy Acton leading Vivek Ramaswamy by 3.8 points. Ramaswamy, a Cincinnati native, won the GOP nomination in May.
The Senate polls are also bunched already. Those 12 polls spread about 2.3 points around the average, while their sample sizes alone would predict about 3.2, by Exchange calculation. With only 12 polls taken over five weeks, that’s a pattern to watch, not proof of herding.
Here’s how much misses of different sizes would matter, as an illustration, not a forecast. A 2024-sized miss of about 2 points would leave Brown barely ahead. The 10-race Ohio average of 5 points would put Husted up about 2. A New Jersey-style miss would widen Brown’s lead. Data journalist G. Elliott Morris tested whether past poll bias predicts the next election’s. In his August analysis, averaging earlier misses called the direction right in 10 of 14 cycles. But the statistical link between past and future misses was shaky. “We cannot statistically distinguish it from zero,” he wrote. “Predicting polling error from previous cycles’ misses works until it doesn’t.”
So, Are Political Polls Fake?
Mostly, no. The polls in the averages come from real interviews with real people, and exposed fabricators are rare. But accurate and fake aren’t the only two options. Ohio polls have leaned the same way for a decade, and nobody can tell yet whether this year’s methods fixed it. A 3-point Brown lead is smaller than Ohio’s average miss over that decade. That doesn’t make Husted the favorite. It means the polls alone can’t settle this race. On Nov. 3, Ohio adds races number 11 and 12 to the scorecard.
FAQs
Are political polls fake?
Mostly, no. Established pollsters interview real people, and confirmed fabricators such as Research 2000 are rare. Junk data does exist, especially in cheap opt-in online panels. In August 2026, Median Strategies retracted its polls and described itself as a “short-term social experiment.” The bigger problem is real polls that miss in the same direction, as Ohio’s have since 2014.
How accurate have Ohio polls been?
Since 2014, polls in the final three weeks of Ohio’s presidential, Senate and governor races underestimated the Republican’s margin by about 5 points on average, by Cincinnati Exchange calculation from FiveThirtyEight’s archive and RealClearPolling. The miss shrank to about 2 points in 2024. RealClearPolling’s own 2022 Senate average ran the other way, overstating JD Vance.
Do polls overestimate Democrats by 3.5 points?
In presidential years, roughly. AAPOR found polls overstated Democratic margins across all offices by 3.1 points in 2016, 4.6 in 2020 and 2.7 in 2024, which averages 3.5. Midterms were far closer: a 0.1-point Democratic overstatement in 2018 and a 0.6-point Republican overstatement in 2022. Polls underestimated Democrats in 2012 and in New Jersey in 2025.
Are most pollsters Democrats?
The Cincinnati Exchange found no study showing that. In FiveThirtyEight’s archive, more than 80% of polls in each even-year election from 1998 through 2022 had no party or campaign sponsor. Partisan-sponsored polls lean toward their sponsors, but polls with no partisan sponsor still overstated Democrats by 3.7 points in 2016 and 4.6 points in 2020.
Do polls tighten right before the election?
Yes. In FiveThirtyEight’s archive, final-week polls of the same race spread less than sampling error predicts in 72% of races, against about 58% expected by chance, by Exchange calculation. That pattern can signal herding, though AAPOR attributed 2024’s tight spread to shared weighting methods. Either way, final-week polls from 2014 through 2022 still overstated Democrats by about 3 points.
This article was reported, fact-checked and edited using The Cincinnati Exchange’s proprietary AI article system as part of our editorial process. Figures were checked against the poll archives, task force reports and official results linked in the article, and an editor reviewed the piece before publication. This is an analysis: calculations labeled as the Exchange’s are the publication’s own, drawn from FiveThirtyEight’s public poll archive and RealClearPolling’s averages, and conclusions drawn from them are the author’s.