



Share This Article
Article Summary:
CPS spends $21,511 per student annually, well above Ohio’s average, yet math proficiency sits at just 23%. As voters weigh a new property tax in November, this piece examines what that spending has actually produced.
Hamilton County homeowners will decide in November whether Cincinnati Public Schools deserves another tax increase.
Before they vote, the state says the district already spends $21,511 per student each year.
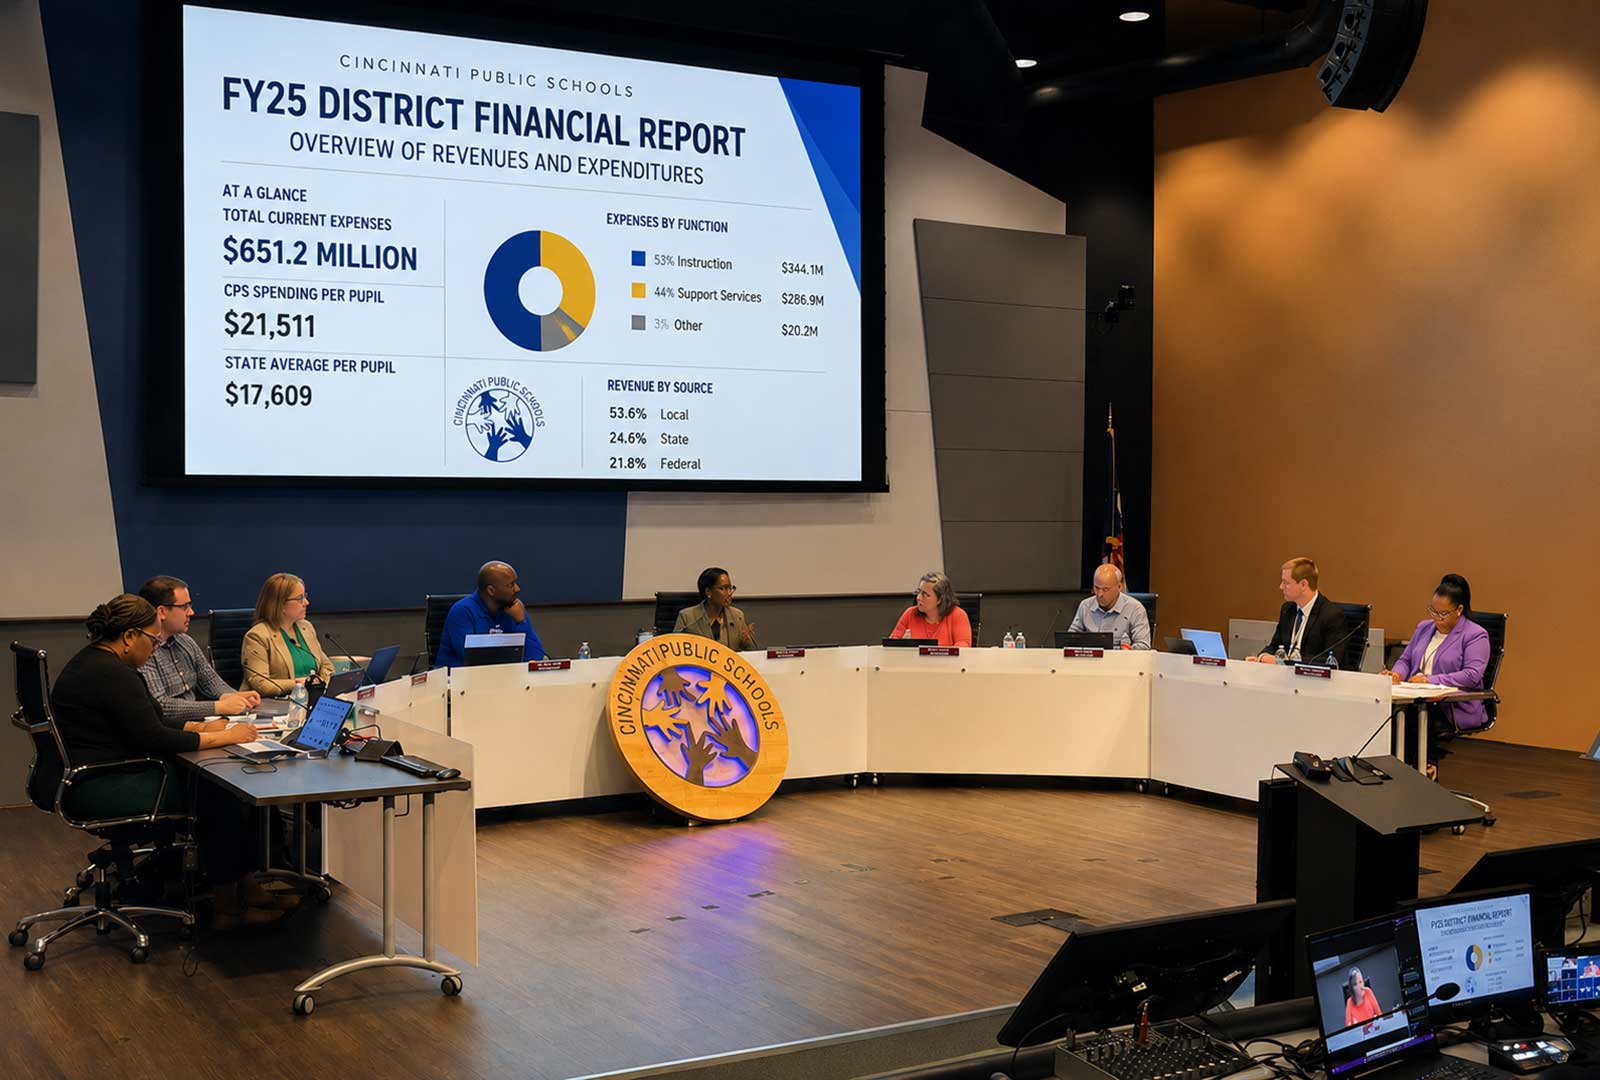
The CPS spending per pupil figure comes directly from the Ohio Department of Education’s FY25 District Profile Report, the same document the state uses to compare districts across Ohio. That ranks well above Ohio’s statewide average of $17,609 per student. This comes after CPS rescinded a levy and replaced it with the property tax now headed to voters, a reversal from the earned income tax the board had approved just a week earlier.
Here’s what those spending levels have produced, by the state’s own measure. Just 23% of CPS high schoolers test proficient in math, despite the district’s CPS spending per pupil total ranking well above the state average. Reading proficiency comes in at 40% for high schoolers, 37% for middle schoolers, and 38% for elementary students. Ohio’s statewide averages sit around 55% for math and 60% for reading, according to U.S. News’ compilation of the same government data. CPS isn’t close on either measure.
A Board Member Asked the Same Question Taxpayers Are Asking
This isn’t just an outside critique. CPS board member Ben Lindy raised the exact same concern from the dais on Aug. 3. That’s the night the board rescinded its earned income tax levy and replaced it with a 7-mill property tax instead. “I believe deeply that two things are true,” Lindy said. “The first is we have very real financial challenges that we need to address.” He didn’t stop there, though. “The thing that’s also true at the same time is that a reasonable voter has good reasons to worry, I think, about whether we will use new revenue in ways that truly make a difference for students.”
Parents made the same point in plainer terms. Ashley Harp-Dillion told WCPO the district hasn’t shown residents what the levy money actually covered. “The solution is creating a plan for the money,” she said, “because we don’t really know a lot about what the levy in the past kind of covered.” Terana Boyd put it more bluntly. “For an administration to continue to ask for money and we’re not seeing positive results, that’s concerning too,” Boyd said. Neither of them opposes funding CPS. However, both said the same thing Lindy did from the board table: show the results before asking for more money.
What the New Levy Actually Costs Homeowners
CPS advertises the new 7-mill property tax as costing $245 a year per $100,000 of home value. That number is accurate, but it understates what most Cincinnati homeowners will actually pay, since the typical home here is worth well more than $100,000. Zillow put Cincinnati’s typical home value at $254,955 as of June 2026. At that value, the new levy costs about $625 a year. That’s roughly $52 a month for a home at Cincinnati’s typical value. Redfin’s median sale price for the same period runs higher, $275,606, which puts the cost closer to $675 a year.
That’s on top of every property tax homeowners already pay, including city, county, library, parks, and CPS’s existing levies. It also shifts who bears the cost compared to the income tax the board rescinded a week after passing it. The income tax would have applied only to district residents’ earned wages, exempting retirees living on Social Security or pensions entirely. The property tax applies to any homeowner regardless of income source, which means fixed-income retirees now share the same bill as working households.
The Comparison That Puts $21,511 in Perspective
Put the number next to something else Ohioans pay for every year. In-state tuition and fees at the University of Cincinnati run $14,824 for the 2026-27 school year. That figure comes directly from the university’s bursar office. Every student sitting in a CPS classroom represents public spending greater than the annual tuition charged to an adult attending one of Ohio’s flagship research universities.
That comparison isn’t perfectly apples-to-apples. UC’s figure doesn’t include room, board or books. CPS’s number covers far more than classroom instruction alone, too, since transportation, building operations, administration and support staff all draw from the same per-pupil total. The comparison doesn’t prove one system should cost the same as the other. It does show how large the spending gap has become.
Where the CPS Spending Per Pupil Total Actually Goes
CPS’s own reported figures show $344.1 million spent on instruction. Support services drew another $286.9 million out of $651.2 million in total current expenses. That’s a real, sourced breakdown, not a vague accusation that the money disappears. Broken into shares: instruction accounts for 53% of spending, support services 44%, and everything else the remaining 3%.
More than half of CPS’s revenue, 53.6%, already comes from local sources, according to the same U.S. News compilation, with 24.6% from the state and 21.8% from federal funds. That local-heavy funding mix is exactly why the district keeps returning to Hamilton County voters. It relies far less on Columbus or Washington than most people might assume. It also means local taxpayers already carry the largest share of the budget. That budget isn’t producing proficiency rates anywhere close to the state average.
How CPS Compares to Other Large Ohio Districts
Cincinnati’s $21,511 per-pupil spending sits well above Ohio’s statewide average, but it isn’t the highest among Ohio’s largest urban districts. It’s actually the second-lowest of the six, according to the same Ohio Department of Education FY25 District Profile Report.
| District | Per-Pupil Spending |
|---|---|
| Cleveland | $25,694 |
| Columbus | $25,649 |
| Dayton | $22,858 |
| Toledo | $22,175 |
| Cincinnati | $21,511 |
| Akron | $21,165 |
That comparison changes the question. The issue isn’t whether Cincinnati spends more than every other big-city Ohio district. It doesn’t; Cleveland and Columbus both spend roughly $4,100 to $4,200 more per pupil. The question voters face is whether $21,511 per student, however it compares with Cleveland or Columbus, is producing results they consider acceptable.
The Graduation Rate Question Nobody’s Fully Answered
Here’s a detail worth flagging rather than smoothing over. CPS’s graduation rate depends, however, on which source and which year gets cited. The Ohio Department of Education’s most recent report card put four-year graduation at 82.5%. A different WCPO report citing state data put it closer to 73%. U.S. News’ current district page lists the figure as “N/A” entirely. That’s a significant discrepancy for voters trying to judge district performance before approving another tax request. Before November, CPS could clear up which figure is actually current and why the sources disagree.
The District’s Strongest Counterargument
District leaders have argued that CPS serves a higher-needs student population than many suburban districts, with more students living in poverty, more English-language learners, and more children requiring specialized services, all of which raise costs and can weigh down test scores regardless of how well a district is run. That argument has real support. CPS’s own chief information officer has publicly described “a large percentage” of the district’s students as economically disadvantaged, and individual CPS schools report poverty rates above 99%. Ohio’s official statewide “economically disadvantaged” statistic is a poor way to check that claim, though. Education researchers at the Fordham Institute note the state’s own figures on economic disadvantage became unreliable after federal free-meal policy changes decoupled the metric from actual poverty measurement.
That leaves the counterargument real but hard to quantify precisely with the data currently available against the CPS spending-per-pupil total. It’s a legitimate factor in any honest accounting of CPS’s results, even if it doesn’t fully resolve the gap between what the district spends and what it produces.
What This Means for the November Vote
None of this proves CPS mismanages its money. The district’s own instructional spending share looks reasonable on paper. Its enrollment decline and the loss of pandemic-era federal funding are real, verifiable pressures. But a district asking Hamilton County homeowners for a new 7-mill property tax carries a real burden. It needs to show what its existing CPS spending per pupil total actually produces. State data shows CPS spends substantially more per student than the Ohio average while producing proficiency rates that remain well below it. Whether voters believe additional revenue will change those outcomes is the question they’ll answer in November.
FAQs
How much does Cincinnati Public Schools spend per student?
CPS spends $21,511 per pupil annually, according to the Ohio Department of Education’s FY25 District Profile Report, 22% above the statewide average of $17,609.
How does CPS's spending compare to other major Ohio cities?
CPS ranks second-lowest among the state’s six largest urban districts. Cleveland ($25,694) and Columbus ($25,649) both spend roughly $4,100-4,200 more per pupil than Cincinnati. Only Akron ($21,165) spends less.
What will the new property tax cost homeowners?
The levy costs $245 per $100,000 of home value per year. At Cincinnati’s typical home value of $254,955, that works out to about $625 a year, or roughly $52 a month.
How does CPS's spending compare to college tuition?
CPS’s per-pupil spending exceeds a full year of in-state tuition and fees at the University of Cincinnati, which runs $14,824 for 2026-27.
Does CPS's student population explain the gap between spending and test scores?
District leaders argue CPS serves more students in poverty, more English-language learners, and more students needing specialized services, all of which raise costs. That argument has real support, though Ohio’s official “economically disadvantaged” statistic is considered unreliable by education researchers, making the claim difficult to verify precisely with current data.
This is an opinion piece and reflects the views of the author. It was produced using a combination of original reporting, publicly available information, and AI-assisted editing, and was reviewed and fact-checked by a human editor before publication. Where this article draws conclusions about what CPS’s spending levels have produced, those conclusions reflect the author’s analysis of state-reported data, not statements from the district or board.