


Share This Article
Article Summary:
CPD’s Aug. 24, 2026 report shows Over-the-Rhine violent crime at 77 incidents year-to-date, down from 83 in 2025. But the long-term comparison to 2005 is less certain because two different baseline totals circulate, Cincinnati’s crime-reporting systems have changed, and key calls-for-service data needed to test the comparison are not publicly available.
OTR Crime Is Down. The 2005 Comparison Has Problems
Cincinnati Police Department’s Aug. 24 report puts Over-the-Rhine at 77 violent offenses this year, down from 83 last year.
City Hall calls that proof Over-the-Rhine crime is falling.
OTR crime numbers did fall this year. CPD’s Aug. 24 report confirms it. That is real progress, and nobody at The Cincinnati Exchange disputes it.
But the story officials, developers and downtown business owners tell about that number skips past a disputed baseline, a shrinking police force and a records system that changed twice. Those are gaps a bar chart on a council slide will never show. The go-to comparison to 2005 is more complicated than it looks once those gaps get checked. It splits into two different totals, and this outlet could not locate an original CPD source document for either one in the city’s current online archives.
Homicides in Over-the-Rhine dropped from eight last year to zero this year. Reported rapes climbed from four to 11, and strangulation cases rose from eight to 12. Robbery fell from 27 to 25, and aggravated assault fell from 36 to 29. Falling homicides and fewer aggravated assaults drove the overall decline. Rape and strangulation moved sharply in the opposite direction. Still, CPD labels the whole report preliminary. Its own three-year average for the neighborhood, 84.33 incidents, sits above this year’s count anyway.
Eight Things Behind the OTR Crime Numbers
Officials citing a falling number rarely walk through everything sitting underneath it. Keep these eight gaps in mind whenever a chart like this one gets held up as proof:
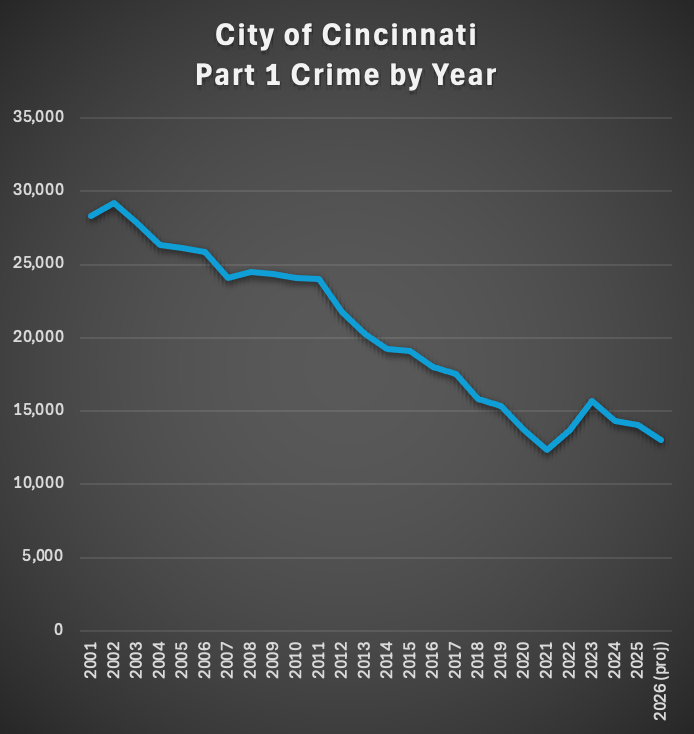
- The 2005 baseline is disputed. Two totals circulate.
- A 911 call isn’t a crime report. An unknown share never becomes one.
- CPD is short-staffed. Fewer patrols plausibly means fewer self-initiated reports.
- Some calls now go to alternative responders instead. A call ARC resolves entirely on its own does not itself generate a CPD offense report.
- Records changed twice since 2005. Old and new totals aren’t tracked the same way.
- Shootings and “violent crime” move separately. They measure different things.
- The last full-year citywide count moved the other way. Citywide violent crime rose about 4% in 2024; OTR’s 2026 report fell.
- Officials and developers have a stake in this. Reason for scrutiny, not proof.
None of that means the decline is fake. It means a crime count like this deserves the same scrutiny any other government claim would get. Each of those eight gaps gets a full accounting below, starting with the baseline everyone reaches for first.
Two Different Numbers for 2005
One version of the 2005 baseline, repeated across years of coverage and city presentations, puts Over-the-Rhine’s violent-offense total at 606. A second, CPD-derived table lists 629 for the same year. Robbery counts differ too, 350 against 355. A review of Cincinnati’s crime-analysis pages and its online neighborhood-report archive turned up neither original tally. CPD’s current public archive does not have the offense-level files behind either number posted. Treating one as a settled baseline overstates how solid that record actually is.
A third figure for 2009 has circulated alongside the other two. It totals five homicides, 18 rapes, 226 robberies and 122 aggravated assaults, a combined 371 violent offenses. That number would sit closer to both 2005 totals than to today’s. That tracks, since 2009 sits only four years removed from the 2005 baseline.
A Feb. 23, 2010 Fox19 article publishes that same neighborhood-by-neighborhood breakdown. That establishes 371 as a genuine, contemporaneously published figure, not an invented one. It does not confirm the underlying number itself. Fox19’s table is a secondary compilation, not the original CPD report it was drawn from, and that original document remains unlocated. None of the three 2005-era or 2009 numbers appear as a line item on the city’s crime-analysis portal today. A 21-year comparison built on secondary reproductions is thinner than the round percentages usually stacked on top of it.
That kind of mismatch is not new to Over-the-Rhine. A 2009 dispute over the neighborhood’s national ranking shows exactly how it happens. A private finance website, WalletPop.com, used 2005-2007 FBI Uniform Crime Report data to project 457 annual violent crimes. The projection covered only the Liberty Street-to-Central Parkway blocks of Over-the-Rhine. It ranked the area the most dangerous neighborhood in the country.
UrbanCincy pushed back at the time. It cited CPD’s own 2007 count: 390 violent crimes across the entire Over-the-Rhine neighborhood. WalletPop’s figure, by contrast, came from a narrower zip-code slice. Neither the ranking nor its critics were describing an FBI designation. Both were describing the same neighborhood in the same era, landing more than 60 offenses apart. They drew its boundary differently.
That is not a 2009 problem alone. It demonstrates how much a boundary or methodology choice can move an Over-the-Rhine total. The same kind of choice could plausibly separate 606 from 629. The actual cause of that specific gap remains unresolved.
A Neighborhood Coming Off Six Years of Federal Oversight
Cincinnati police shot and killed 19-year-old Timothy Thomas in an Over-the-Rhine alley on April 7, 2001. He was the fifteenth Black man killed by Cincinnati police since 1995. Unrest broke out across the city two nights later and continued for days, in what a federal review later called the largest urban disturbance in the country since the 1992 Los Angeles riots.
The city signed the resulting Collaborative Agreement with the police union, the ACLU and the Cincinnati Black United Front in April 2002. A parallel U.S. Department of Justice agreement forced new use-of-force rules and outside monitoring of the department. Federal court supervision of those reforms did not end until August 2008, three years after the 2005 baseline Cincinnatians still argue about today.
That timing matters more than a footnote. RAND’s own evaluation of the reform era, cited above, found Over-the-Rhine arrests jumped 25% from 2004 to 2005 alone, the same year now treated as a neutral starting line. Officers spent 2005 under a federal consent decree, adjusting to new complaint-review rules and an arrest surge inside the neighborhood where the unrest began. A baseline drawn from the middle of an externally supervised policing overhaul, following the department’s most disruptive year in decades, is not the stable reference point a simple percentage decline implies.
How an Event Becomes a Statistic
“77 violent crimes” sounds like a count of dangerous incidents. It’s closer to the output of a multi-step reporting system. Cincinnati’s own calls-for-service documentation lays out the sequence. An incident occurs, someone reports it, or an officer discovers it, and dispatchers log it through CAD. An officer responds, updates the disposition, and only some of those calls become a formal offense report. The city says plainly that its calls-for-service data excludes “crime data/case records (RMS data), arrest information, final case determination, or any other incident outcome data.”
A 911 call and a crime report are two different things, tracked in two different systems. Cincinnati’s own Reported Crime page repeats the same separation for its offense dashboard.
That gap matters for a benchmark argument built entirely on OTR crime numbers as they appear on the offense dashboard. A shots-fired call nobody investigates as a crime never becomes a Part 1 offense. A fight broken up before anyone files a report never becomes one either. None of that means CPD is manipulating anything. The Cincinnati Exchange could not locate a published Cincinnati series showing how many violence-related calls for service turn into an actual offense report each year. Nobody outside CPD knows whether that conversion rate has moved since 2005.
Most Violent Victimization Involving Urban Residents Never Reaches Police
A police-reported crime total is not a count of everything that happened. It is the output of a chain, and every link has to hold:
- An incident happens.
- Someone reports it, or an officer discovers it directly.
- A response follows.
- Someone files a report.
- Someone classifies the event into an offense category.
- That offense lands in whatever statistic officials cite.
If any link breaks, the incident never reaches the final number, whether or not it was real.
The Bureau of Justice Statistics estimated that only about 38% of violent victimizations involving urban residents reached police nationally between 2020 and 2023. That figure excludes homicide, and it does not establish Cincinnati’s own reporting rate. Nor does it prove Cincinnatians call police less often today than they did in 2005. What it does establish is that police-reported crime captures only part of the violence urban residents experience nationally.
A separate BJS victimization bulletin explains some of why. Victims cite fear of reprisal, a belief that police would not or could not help, and a sense that the incident was too personal or too trivial to report. Cincinnati layers its own local variables on top of those national patterns. A shrinking police force, new alternative-response programs, private security patrols, and a records system that changed twice each get their own section below.
Using this 2005-to-2026 comparison to make claims about how much violence residents actually experienced rests on a narrower assumption: that the relationship between victimization, reporting, and police recording did not change materially over 21 years. The public record does not establish that assumption. None of this means Over-the-Rhine’s recorded decline is fake. It means a crime count measures reported crime, not a census of everything that happened. The sections below test how much of that reporting chain has actually changed since 2005.
Fewer Officers Are Doing the Discovering
A shrinking police force is its own hidden variable in that funnel, separate from anything happening inside CPD’s records systems. Cincinnati’s Fraternal Order of Police told Local12 in August 2025 that the department was carrying 147 vacancies against an authorized strength of 1,091 sworn officers, about 13.5% short. Later reporting from The Cincinnati Exchange put the gap at roughly 15%. It warned CPD could fall short by well over 150 officers without aggressive hiring. The city’s approved FY2026-2027 budget lists a lower authorized figure, 1,059 sworn positions. That is another instance of Cincinnati’s own public safety numbers shifting depending on which document a resident reads.
Interim Police Chief Adam Hennie has responded by concentrating available officers downtown and in Over-the-Rhine. The response also includes expanding drone coverage and a proposed 9 p.m. curfew district in part of the neighborhood. That triage approach makes sense given the vacancy numbers above, but it means Over-the-Rhine and downtown get concentrated coverage other neighborhoods currently do not.
Fewer officers on patrol plausibly means fewer proactive stops and fewer directly observed low-level offenses. None of that requires a single Cincinnatian to change how often they call 911. It only requires fewer officers available to generate a report on their own initiative. Cincinnati’s own crime-data documentation distinguishes that officer-initiated activity from citizen-initiated calls, but it does not publish the split by neighborhood. Nobody outside CPD can currently say how much of Over-the-Rhine’s declining offense count reflects that shift rather than a reduction in actual crime.
Some OTR Calls Now Go to ARC Instead of Patrol Officers
Staffing is not the only thing that changed since 2005. Cincinnati now routes some 911 calls away from police entirely. The city’s Alternative Response to Crisis (ARC) program sends an unarmed behavioral health specialist and a paramedic to low-risk welfare checks, trespassing complaints, and disorder calls instead of a patrol officer. During the program’s first four months, WCPO reported that most of its calls came from downtown and Over-the-Rhine.
ARC responders are unarmed and do not perform law enforcement duties themselves. Cincinnati’s own program rules limit it to low-risk calls and say a traditional police response is dispatched instead whenever a 911 call-taker judges that the situation needs one. An eligible low-risk call resolved entirely by ARC does not, by itself, generate a CPD offense report, even though it would likely have gone to a Cincinnati police officer before the program existed.
3CDC’s Clean & Safe Ambassadors add a second layer of a similar kind. More than 80 of them patrol Over-the-Rhine and downtown daily, and an Ambassador encounter is not itself captured as a CPD offense report unless it results in police involvement and a report being taken.
None of this means that Cincinnati manufactured a decline in crime by rerouting calls. City officials designed ARC and Clean & Safe to reduce unnecessary police contact, not to hide offenses. Low-level disorder calls were never the violent offenses driving the Part 1 total anyway. But treating CPD’s offense count as a complete record of neighborhood disorder ignores a response system that did not exist in 2005, one that now absorbs an unknown share of the incidents that residents used to call the police about directly.
A Records System That Changed Twice
Two recent changes make a clean 2005-to-2026 line even harder to draw. Under Senate Bill 288, Ohio’s strangulation law took effect April 4, 2023. Cincinnati responded by tracking strangulation as its own line inside Part 1 violent crime. Older reports folded it into general assault instead. Then, on June 3, 2024, CPD switched its records management systems entirely. The city now publishes two separate public crime datasets, split at that date. The old and new systems simply don’t store incident information the same way. Those changes do not necessarily invalidate a long-term comparison, but they make an exact percentage claim impossible to evaluate without a documented offense-code crosswalk that Cincinnati has not published.
Shootings and Part 1 Violent Crime Measure Different Things
Part 1 violent crime and gun violence are not the same measurement. Over-the-Rhine is the clearest local example of why that gap matters. According to CPD’s CY2015 year-end report, the neighborhood’s shooting victims ran 69 in 2011, 41 in 2012, 55 in 2013, 28 in 2014, and 36 in 2015. That’s a series swinging by more than half some years, not a straight decline.
The city drafted its own OTR PIVOT plan to justify a targeted policing response in the neighborhood’s northern half. It says shootings there rose 67% between 2019 and 2020, from 27 shooting victims to 45. The PIVOT plan tracks only shootings. It does not report whether the neighborhood’s broader Part 1 violent-offense count moved with that increase or against it over the same two years, leaving that comparison unanswered by the city’s own planning document.
Four years later, Over-the-Rhine again led every Cincinnati neighborhood in shooting victims. Its 2024 total of 39 sat close to its recent-year norm rather than marking a fresh spike. The shooting-victim series does not show the same smooth trajectory implied by a simple 2005-to-2026 Part 1 comparison. It is a separate measure of violence, and one worth tracking alongside the broader total of offenses.
What “Crime Is Down” Leaves Out Citywide
City officials citing Over-the-Rhine’s improving 2026 numbers rarely mention that Cincinnati’s own citywide figures tell a messier story. CPD told City Council’s Law and Public Safety Committee in February 2025 that overall violent crime rose by about 4% in 2024, the most recent full year for which a citywide breakdown is available. Homicides ticked up too, from 72 to 73. Citywide shooting victims did fall, from 379 in 2023 to 355 in 2024. But that citywide decline masks sharp neighborhood divergence. A Local12 neighborhood breakdown found Over-the-Rhine led every neighborhood in shooting victims at 39 that year. West End fell from 41 to 30, while Avondale and Winton Hills both climbed.
This outlet independently pulled Cincinnati Police Department’s own neighborhood report PDFs, the same public reports behind Over-the-Rhine’s own figures, for five other neighborhoods as of late August 2026. Avondale’s Part 1 violent total rose from 68 to 84 year-to-date, up 23.5%. West End rose from 63 to 68, up 7.9%. Winton Hills rose from 53 to 65, up 22.6%. Westwood held essentially flat, 111 to 112. Bond Hill’s own report, last updated a month earlier than the others on July 20, 2026, already showed violent crime nearly doubling, from 19 to 39. Four of those five neighborhoods are getting worse in the same year CPD’s own numbers show Over-the-Rhine improving.
Bond Hill’s report, which carries an older update date than the others, is its own small finding. CPD refreshes each neighborhood’s PDF on its own schedule, not all at once, so a citywide snapshot pulled on a single day quietly mixes reports current to different weeks. That is one more reason a single “crime is down” headline glosses over more than it reveals.
A 2025 WCPO fact-check of Mayor Aftab Pureval’s own “crime is down” framing found the same pattern up close. Citywide crime through August 2025 ran essentially flat compared with 2024, up just 0.5%, even as downtown reported crimes were 31% above their four-year average. Shooting victims were down that year, 156 compared with 201 over the same months in 2024, real evidence of an aggregate decline even as it plays out unevenly block by block. The mayor’s own comment on the gap, that the numbers “mean nothing if the public perception does not match” them, describes the same tension behind Over-the-Rhine’s safety-satisfaction numbers below.
This is the piece missing from most “crime is down” citations. A citywide average can fall while specific places, categories, or years inside it move in the opposite direction. Officials should not treat Over-the-Rhine’s improving 2026 report as proof of a citywide trend when the most recent full-year citywide breakdown, 2024, moved the other way. Over-the-Rhine’s own shooting-victim count, per CPD’s own reports, has not meaningfully declined from its recent-year average either. CPD’s own neighborhood reports show why that distinction matters. Over-the-Rhine improved this year while Avondale, Winton Hills and Bond Hill posted double-digit increases over the same comparison window.
Why Over-the-Rhine Gets Outsized Attention
Over-the-Rhine is not just one neighborhood among many in this debate. OTR’s falling Part 1 total provides City Hall with a highly visible measure of progress in a neighborhood that has received extraordinary public and private investment. More than $2.5 billion has gone into downtown and Over-the-Rhine development projects over more than two decades, per 3CDC’s own project count. The neighborhood’s image as a revitalization model rests heavily on that investment holding up. Downtown and Over-the-Rhine property owners, developers, bars and restaurants have an obvious commercial interest in the neighborhood’s reputation for safety. None of that is hidden, and none of it proves anyone manipulated a number.
What is measurable is where the resources actually went. CPD concentrated its shrinking pool of officers downtown and in Over-the-Rhine, as noted in the staffing section above. 3CDC’s Ambassador patrols and more than $2.5 billion in investment are also concentrated there. Avondale, Winton Hills and Bond Hill, by contrast, have received far less redevelopment money, private security or sustained media attention. CPD’s own current numbers show violent crime climbing by double digits in each of them this year. Readers can draw their own conclusions about why; the reporting above lays out the pattern.
A safety narrative built around one closely watched neighborhood can be entirely accurate. It can still describe the wrong part of the city for a resident in Bond Hill or Avondale.
$2.5 Billion Later, It Isn’t the Same Neighborhood
3CDC’s own project count puts total development activity in Downtown and Over-the-Rhine at more than $2.5 billion. That includes 213 restored buildings, 51 new ones, and 20 acres of restored civic space. 3CDC’s own About page describes the organization’s direct role more narrowly. It reports a $2 billion investment across more than 100 development projects since its founding in 2003.
Next door, in the West End, the city demolished the Laurel Homes and Lincoln Court public-housing complexes starting around 2000. Laurel Homes opened in 1938 with 951 apartments. Lincoln Court opened in 1942 with 886 apartments across 53 buildings, per a University of Delaware and University of Cincinnati HOPE VI case study. HUD’s own 1999 grant announcement independently confirms the 951 figure for Laurel Homes.
Lincoln Court’s relocation began in April 1999. Laurel Homes’ relocation began in January 2000, and its demolition started that November. That demolition and relocation predates the 2005 baseline everyone cites. The “crisis-era” comparison year already sat within an active demolition-and-displacement period next door, not before one.
3CDC’s Clean & Safe program adds a layer that 2005 lacked. More than 80 Ambassadors patrol Downtown and Over-the-Rhine seven days a week, 7 a.m. to 11 p.m. They logged over 110,000 staff hours in 2024, a 10% increase over the year before. The program pushed into North Over-the-Rhine in October 2024, adding two dedicated staff working that stretch of the neighborhood daily. Routine Ambassador patrol activity does not, by itself, show up in a CPD offense report, and nothing like it existed in 2005.
Policing changed too, and earlier than most of the redevelopment money arrived. A RAND Corporation evaluation of Cincinnati’s police-reform agreement found that arrests in Over-the-Rhine jumped 25% from 2004 to 2005. They rose another 9% in 2006. Crime in the neighborhood then fell 13% more than citywide trends would have predicted, once the city’s April 2006 task force began operating.
A separate 2007 University of Cincinnati master’s thesis independently documents just how concentrated that decline was. It examined “Operation Vortex,” a CPD aggressive-patrol unit that targeted Over-the-Rhine starting in early 2006. Robbery in the neighborhood fell 48% in that single year, 2005 to 2006. That points to a sharp, dated drop rather than a steady 21-year decline, at least for robbery specifically. This outlet has not found an equivalent single-year breakdown for the full Part 1 violent-crime total.
Supporters of the redevelopment case have real evidence on their side, since investment, policing and rehabilitation all point in the same direction. What that evidence doesn’t support is treating 2005, a year already mid-transformation, as a neutral yardstick. The enormous public and private investment poured into Downtown and Over-the-Rhine aimed to produce a revitalized urban core, not a return to crisis-era safety. Two decades later, that investment is the standard against which to measure, not the crime rate from the year the rebuilding began. That’s a different claim than saying the Vine Street corridor hasn’t changed. It plainly has.
What Cincinnatians Actually Say About Feeling Safe
The gap between official crime totals and lived experience draws heated public pushback whenever it resurfaces. Residents say the numbers don’t match what they see and hear day to day. That reaction is itself a data point, even if it isn’t a substitute for records.
Cincinnati’s own 2025 resident survey found that 32% of respondents felt satisfied with the city’s overall safety, down from 40% in 2023 and 42% in 2021. The survey’s benchmark group of similarly sized cities came in at 53%, a 21-point gap. Satisfaction with safety in one’s own neighborhood reached 50%, again trailing the peer-city number.
Resident and community safety topped the city’s FY2026 budget-priority survey: 48% of respondents named it one of their top three funding priorities for the coming budget, more than any other category, and it was also the single most commonly chosen first choice, at 23.8%. Increased visibility of patrol officers was a top-three safety priority for 53% of respondents.
None of that is specific to Over-the-Rhine’s crime numbers, and a perception survey measures something different than a police-reported offense count. But a declining official total, alongside that same decline in the city’s own safety-satisfaction survey, is its own kind of divergence. It sits on top of the one between shootings and Part 1 crime already documented above. Cincinnati’s bar and nightclub owners in Over-the-Rhine have been living that gap directly. They watch officials cite falling crime totals while managing the fallout from shootings near their own front doors.
No Cincinnati Study Has Tested This Reporting Question
The reporting gap described above sits atop a local one. Over-the-Rhine underwent a documented, decades-long stretch of demographic and economic turnover across the same window used for the 2005 comparison, exactly the kind of change that could move a neighborhood’s reporting behavior on its own. A University of Cincinnati Law Review analysis by Madeline High examined that displacement directly, across housing, culture, and household income.
Real numbers exist for the population side of that turnover. Over-the-Rhine’s population fell from 7,580 in 2000 to 6,964 in 2010 to 6,710 in 2020. That is an 11.5% decline, per a 2022 study commissioned by the Over-the-Rhine Community Council. Recorded violent offenses fell much further over the same stretch, from 606 or 629 in 2005 to 77 today. Population loss alone explains only a small fraction of the recorded decline.
The city’s own 2020 Census profile for the neighborhood lists a different total, 5,622, using four of the five tracts. The same boundary problem documented above for 2005 and 2009 reappears in the population count. None of this measures whether residents who left and those who moved in call the police at different rates. It measures only that population fell by about a tenth. Recorded crime fell by far more, a gap population loss alone cannot close.
A narrower hypothesis adds one possible thread to that broader pattern. The rise of the “Karen” meme after 2018 created a powerful cultural stigma around unnecessary or discriminatory calls to police. Two viral incidents did the most to drive it. Jennifer Schulte called police in 2018 about Black men grilling at Oakland’s Lake Merritt, and Amy Cooper falsely told police in 2020 that a Black birdwatcher, Christian Cooper, was threatening her in Central Park. Both turned “Karen” into shorthand for weaponizing police against Black people in public. Whether that stigma also discouraged some legitimate reporting of actual disorder has not been established.
A 2016 American Sociological Review study by Matthew Desmond, Andrew Papachristos and David Kirk estimated that Milwaukee’s 911 calls dropped by roughly 22,200 in the year after a publicized police beating there. A 2020 reanalysis in the same journal directly challenged that finding. Researcher Michael Zoorob reran the analysis with different modeling choices and found no statistically significant citywide drop.
The Cincinnati Exchange could find no published Cincinnati-specific analysis testing whether residents’ reporting behavior changed over this period. The right question isn’t whether a meme suppressed Cincinnati’s numbers. It’s whether the rate at which Cincinnati residents report crime and disorder has changed over time, a question a dataset could actually answer: disorder, shots-fired and fight calls set beside shootings, homicides and other indicators less dependent on citizen reporting. Neither hypothesis is established, and nobody has ruled either one out. CPD and Cincinnati’s Emergency Communications Center hold the calls-for-service and offense data that could test it, the same records requested below.
What The Cincinnati Exchange Is Asking Cincinnati Police to Release
A city that wants “crime is down” to mean something specific about Over-the-Rhine’s crime numbers already has the records to test it. The Cincinnati Exchange is calling on CPD’s Crime Analysis Unit, the Emergency Communications Center, 3CDC, the Cincinnati Fire Department, the Hamilton County Coroner’s Office, and Ohio’s Division of Emergency Medical Services to release the following. All of it should come in machine-readable format with a documented code crosswalk:
- The underlying 2005 dataset behind either the 606 or 629 total, and an explanation for the other number.
- Annual OTR calls for service since 2010, by type: shots-fired, fight, disorder, trespass, suspicious-person, and criminal-damaging calls.
- Those same calls are split between citizen-initiated and officer-initiated, with dispositions (including unable-to-locate and gone-on-arrival) and average response times.
- The share of those calls that generated an offense report each year, the share that didn’t, and how both have changed since 2010.
- Annual counts of incidents ARC and 3CDC’s Ambassadors handled without CPD involvement.
- One reconciled OTR offense series from 2000 through 2026, using a single counting method and reported annually, to show when the decline actually happened rather than just its two endpoints.
- Cincinnati Fire Department EMS gunshot and assault-response counts for Over-the-Rhine.
- Hamilton County Coroner’s Office homicide and death records for Over-the-Rhine.
- Aggregate penetrating-trauma and gunshot-wound figures from Ohio’s Division of Emergency Medical Services, which maintains the state trauma registry under the Department of Public Safety and already publishes annual statewide gunshot-wound statistics.
- Aggregate city or neighborhood-level trauma-center data, if local hospitals are legally able to provide it.
Those last figures, cross-referenced against CPD’s own shooting-victim and homicide counts for the same years, are less dependent on citizen reporting. That makes them a check on whether Over-the-Rhine’s offense totals move with them or apart from them.
This test can point either way, and it should. Consider one outcome. Citizen-initiated calls, shooting victims, EMS gunshot and assault responses, coroner records, and recorded Part 1 offenses all fall by similarly large amounts over the same years. That convergence would support the simpler explanation: Over-the-Rhine got safer, and the recorded numbers show it. Now consider the other outcome. Recorded offenses fall while shootings or medical responses hold flat or rise instead. That divergence would justify the scrutiny called for above, not disprove it. Nothing about this request is built to reach only one conclusion.
Officials who respond to those requests could substantially reduce the uncertainty. The records would show whether reported offenses moved in step with citizen calls, shootings, medical responses, and other independent indicators, or apart from them. The comparison to 2005 does show something real: Over-the-Rhine’s recorded violence has fallen enormously over two decades. What it does not yet show is whether Cincinnati measured both ends of that comparison the same way, or whether it answers the public-safety question Cincinnatians are actually asking about 2026.
Readers who want to explore Cincinnati’s neighborhood crime data on their own, rather than wait on the records requested above, can use the Cincinnati Neighborhood Crime Explorer, an independent tool built on the city’s own CAGIS, STARS and PDI data. Its creator, Michael Hiles, labels it explicitly as an independent analytical project, not an official CPD publication, and The Cincinnati Exchange has not independently verified every figure it displays. Its current Over-the-Rhine total lines up with the CPD report cited above.
FAQs
Is crime actually down in Over-the-Rhine in 2026?
Cincinnati Police Department’s Aug. 24, 2026 neighborhood report shows 77 Part 1 violent offenses in Over-the-Rhine year-to-date, down from 83 over the same period in 2025, a decline driven mainly by zero recorded homicides compared with eight the year before. CPD labels the data preliminary.
Why isn’t the comparison between Over-the-Rhine’s 2026 crime numbers and 2005 as simple as it looks?
Two different CPD-derived totals for 2005, 606 and 629 violent offenses, have circulated for years and neither traces to a document Cincinnati Police Department has published in full. A similar boundary-driven discrepancy showed up in 2009, when a private ranking’s zip-code-based total for part of the neighborhood came in more than 60 offenses higher than CPD’s own count for the full neighborhood that year.
Is Cincinnati Police Department fully staffed, and does that affect the crime numbers?
No. Local reporting put CPD’s vacancy rate at roughly 13-15% below authorized strength through 2025, a gap of well over 100 officers. Fewer officers on patrol plausibly means fewer proactive stops and self-initiated reports, a variable Cincinnati’s own crime-data documentation tracks but does not publish by neighborhood.
Does Over-the-Rhine’s falling crime count reflect fewer calls going to police at all?
Partly unknown. Cincinnati’s Alternative Response to Crisis program sends an unarmed specialist to low-risk welfare checks, trespassing complaints and disorder calls instead of an officer, and a call it resolves entirely does not itself generate a CPD offense report, though police can still be dispatched if the situation calls for it. 3CDC’s Clean & Safe Ambassadors work similarly. Neither response system existed in 2005.
How many people were shot in Over-the-Rhine over the last 15 years?
CPD’s own year-end reports put Over-the-Rhine shooting victims at 69 in 2011, 41 in 2012, 55 in 2013, 28 in 2014, 36 in 2015, 45 in 2020 (up from 27 in 2019, a 67% jump documented in the city’s OTR PIVOT plan), and 39 in 2024, when Over-the-Rhine led every Cincinnati neighborhood in shooting victims. The series moves independently of the Part 1 violent-crime total in the same years.
Is crime down citywide in Cincinnati, not just in Over-the-Rhine?
Not consistently. CPD told City Council in February 2025 that citywide violent crime rose about 4% in 2024, and a 2025 WCPO fact-check found downtown crime running 31% above its four-year average even as some other measures held flat or fell. A neighborhood-level decline in Over-the-Rhine does not describe the citywide trend.
Does official crime data capture every violent crime that happens in Over-the-Rhine?
No. A police-reported offense total only includes incidents that get reported or independently discovered, then generate a report and get classified. The Bureau of Justice Statistics estimates only about 38% of violent victimizations involving urban residents nationally were reported to police between 2020 and 2023. That figure doesn’t establish Cincinnati’s own reporting rate, but it shows recorded crime measures reported crime, not a full census of what happened.
Has anyone tested whether Cincinnati residents report crime differently than they used to?
The Cincinnati Exchange could find no published Cincinnati-specific analysis testing it. Two plausible explanations for part of the recorded decline, decades-long demographic turnover in Over-the-Rhine and a possible post-2018 cultural shift around calling police (the “Karen” narrative is one example, not the whole explanation), remain untested locally because no published data pairs calls-for-service with recorded offenses. Neither hypothesis is established, and neither is ruled out.
What should Cincinnati residents watch for when officials cite a falling crime number?
At least eight things: whether the baseline year is itself disputed, whether the count includes 911 calls that never became a report, whether the police department citing the number is fully staffed, whether alternative responders or private security are diverting calls before they reach police, whether the records system changed recently, whether shootings are moving the same direction as the broader violent-crime count, whether the citywide trend matches the neighborhood trend being cited, and who has a financial or political stake in the number holding up. None of that means a given decline is false. It means a single statistic deserves the same scrutiny any other government claim would get.
Which Cincinnati neighborhoods are seeing crime rise even as Over-the-Rhine’s numbers fall?
CPD’s own neighborhood report PDFs, independently pulled by this outlet as of late August 2026, show Avondale’s Part 1 violent total up 23.5% year-to-date, Winton Hills up 22.6%, and Bond Hill’s own report already showing violent crime nearly doubling as of late July. West End rose 7.9% and Westwood held essentially flat. Four of five neighborhoods checked are getting worse the same year Over-the-Rhine improved.
Why does Over-the-Rhine get outsized attention over other Cincinnati neighborhoods?
Over-the-Rhine’s falling total gives City Hall a highly visible measure of progress in a neighborhood that has received extraordinary public and private investment, part of more than $2.5 billion in combined downtown and Over-the-Rhine development projects per 3CDC’s own project count. Downtown and OTR property owners, developers, bars and restaurants have a direct financial stake in that reputation holding up. None of that proves manipulation. What is documented is where resources actually went: CPD concentrated its shrinking police force in Over-the-Rhine and downtown, per the staffing section above, while Avondale, Winton Hills and Bond Hill, where CPD’s own current numbers show violent crime climbing by double digits, received far less redevelopment money, private security or sustained attention. Readers can draw their own conclusions about why.
This article was reported, fact-checked, and edited using The Cincinnati Exchange’s proprietary AI article system as part of our editorial process. This piece contains the writer’s analysis of public records and survey data, presented separately from the verified factual reporting above.