



Share This Article
Article Summary:
Non-fatal shootings in Cincinnati are up 27% through early July. Fatal shootings are down 28%. Here is what the latest CPD data shows — and what it means heading into the summer’s most dangerous months.
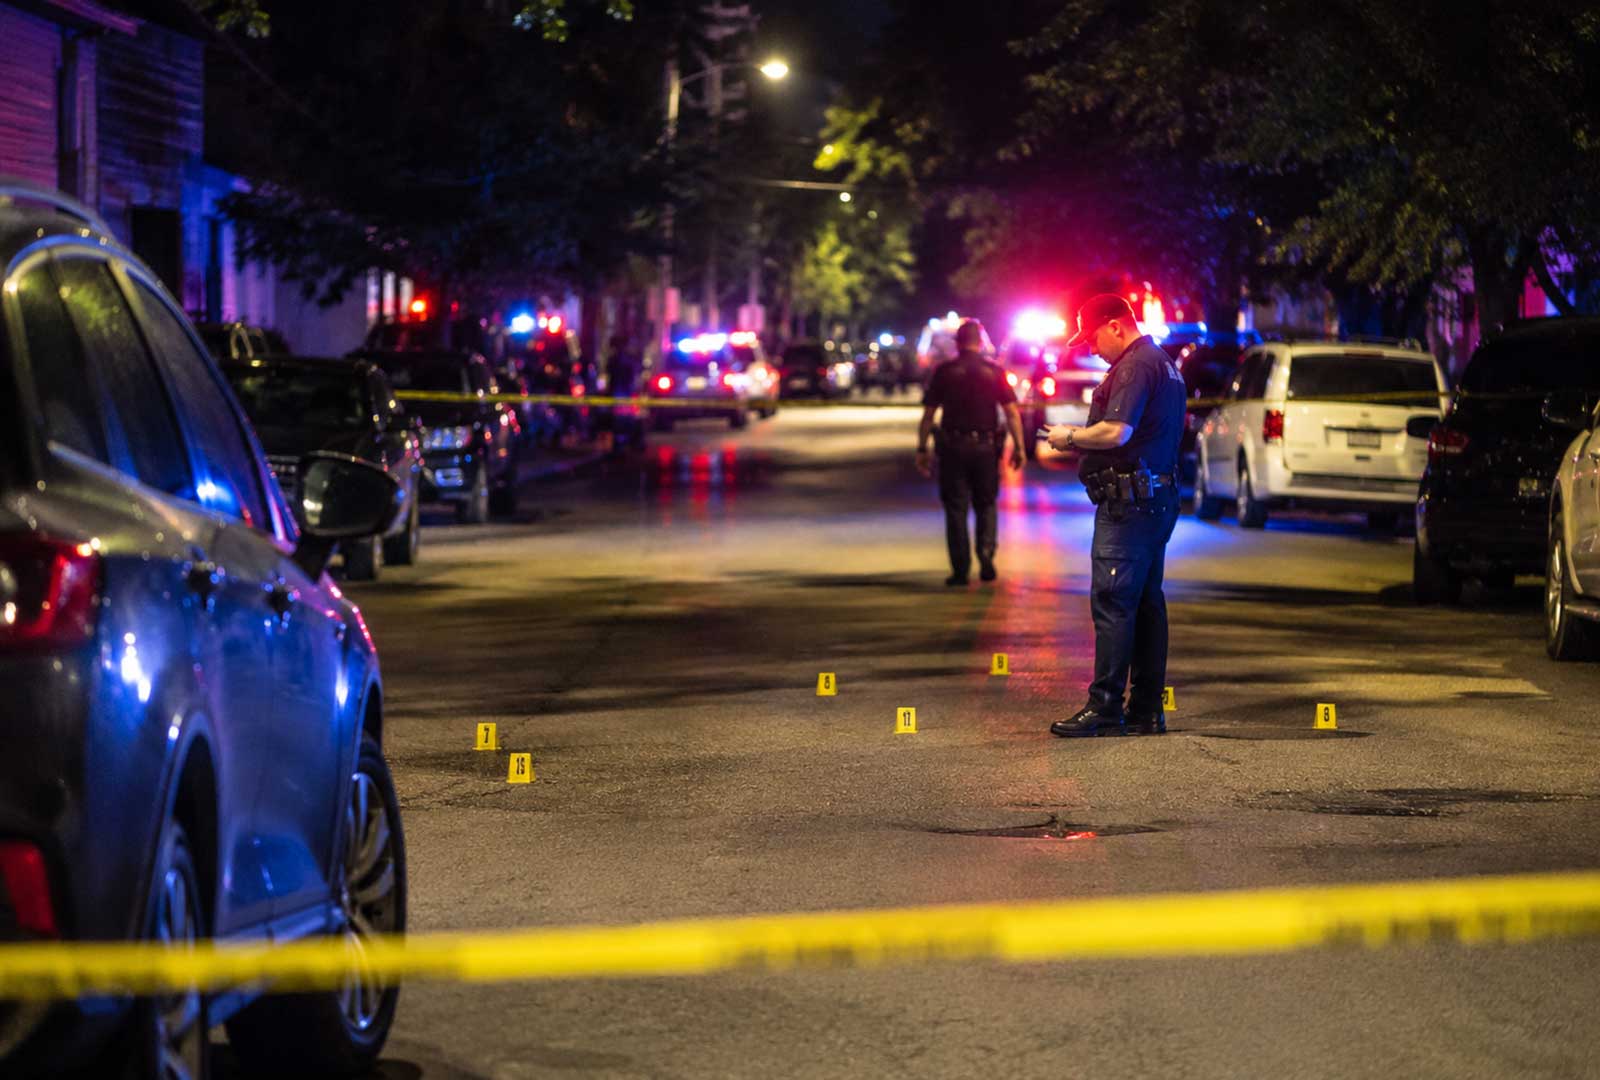
A stretch of downtown around Government Square was taped off again overnight after a juvenile was shot.
By Tuesday morning, another shooting had sent officers to the West End.
Before Cincinnati reached the middle of July, residents had already watched another week of gun violence unfold across multiple neighborhoods. The recent Cincinnati shootings in 2026 have left many community members feeling anxious and searching for solutions.
That feeling of persistence is not wrong.
Through July 7, Cincinnati has recorded approximately 122 shooting victims year-to-date. Overall shooting victims are up 12% compared to the same point in 2025. Non-fatal shootings — the incidents that drive most of the daily headlines — are up even more sharply, about 27%. Those numbers come from CPD’s CincyInsights shooting dashboard and are preliminary, but the trend is clear enough.
| Metric (Through July 7) | Change vs. 2025 |
|---|---|
| Shooting victims | +12% |
| Non-fatal shooting victims | +27% |
| Gun deaths | –28% |
| Homicides | –27% |
The city is on pace to exceed last year’s total. Whether it reaches the levels of 2023 — the recent high-water mark at 313 shooting incidents — depends heavily on what happens between now and September.
Non-Fatal Shootings Are Up. Fatal Shootings Are Down. Both Are True.
Here is where the picture gets more complicated.
While non-fatal shootings are rising, fatal gun violence is moving in the opposite direction. Gun deaths are down roughly 28% compared to the same period in 2025. Homicides overall are down about 27%.
That split — more people shot, fewer people dying — is unusual enough to warrant an explanation. Dr. Theron Bowman, an expert in policing and law enforcement oversight, told Local 12 that improved emergency response protocols could be a factor. Faster EMS response times and better trauma care can convert what would have been a fatality into a non-fatal injury. Ken Kober, president of Cincinnati’s Fraternal Order of Police, pointed to a different set of causes — low bonds, lenient sentencing, and officer retention problems — as driving the overall increase in shooting victims.
Both explanations can be true at once. More people are getting shot. Fewer of them are dying. The reasons for each trend may be entirely different.
Summer Is When Cincinnati’s Numbers Always Move
Decades of crime data show Cincinnati’s most violent months typically arrive during the summer, when more people spend time outdoors, and conflicts are more likely to happen in public. July through September have historically been the busiest months for gun violence in the city.
That matters for reading the current numbers. A 12% increase in shooting victims through early July does not tell us where the year ends. It tells us the city is already entering its most dangerous stretch, running above last year’s pace. As our earlier reporting on Cincinnati’s public safety strategy noted, CPD is simultaneously navigating a staffing shortage that leaves the department about 15% below authorized strength — a compounding factor as summer demand peaks.
Context That Matters
For perspective, here is how 2026 compares to recent years:
| Year | Shooting Incidents |
|---|---|
| 2023 | 313 |
| 2024 | 296 |
| 2025 | 241 |
| 2026 | On pace to exceed 2025 |
Last year created an unusually low comparison point. If 2026 finishes above 2025, that does not automatically mean Cincinnati is returning to its most violent period. It does mean the city has lost some of the gains officials celebrated just a year ago.
That matters for residents in the West End, Price Hill, and Northside — neighborhoods that absorb a disproportionate share of these incidents — where “better than the worst years” offers little comfort when the reports keep coming week after week.
Where the Shootings Are Concentrated
Gun violence in Cincinnati is not evenly distributed. It never has been.
A small number of neighborhoods account for a disproportionate share of shooting incidents year after year. The West End, Avondale, Winton Hills, Millvale, and Villages at Roll Hill consistently rank among the top in CPD’s incident data. A 2026 neighborhood safety analysis found that just five neighborhoods — all clustered in the city’s lower-income urban core — account for the bulk of Cincinnati’s most serious crime concentration. Each of those five carries a D or F safety grade, while 83% of Cincinnati’s 114 neighborhoods rate A or B.
That concentration matters for reading citywide statistics. A 12% increase in shooting victims does not mean every neighborhood is 12% more dangerous. For most of Cincinnati, the lived experience of gun violence remains distant. For residents in the West End or Avondale, it is a recurring summer fact. The economic pattern is consistent: neighborhoods with the highest shooting rates also tend to have the lowest median household incomes. The city’s overall median household income sits at $42,663 — well below the Ohio and national medians. In neighborhoods graded D or F, incomes fall significantly lower.
CPD’s neighborhood crime reports, updated regularly, show year-to-date figures and three-year averages for each of the city’s 52 neighborhoods. For residents who want to track conditions in a specific area rather than reading citywide averages, that is the most granular public data available.
The downtown picture is somewhat different. The Central Business District recorded four shooting incidents through the most recent CPD STARS report — one fewer than the same point last year. Downtown shootings often receive disproportionate attention because they happen where more cameras, commuters, and reporters are already present. The debate over public safety perception vs. reality was a central theme in this year’s Cincinnati mayoral debate, where both candidates clashed over whether the numbers align with what residents experience.
The Public Housing Connection to Cincinnati Shooting Statistics
Two neighborhoods that appear most frequently in Cincinnati’s shooting data share a specific origin: both are products of mid-20th century concentrated public housing policy.
Millvale was developed in the 1950s by the Cincinnati Metropolitan Housing Authority. It carries the city’s lowest safety grade — an F — and a poverty rate above 60%. On June 21, three people were shot and killed on Millvale Court in a single night: Kenneth Burton, 38, Theresa Dudley, 53, and Brenea Burton, 41. As our reporting on that night documented, it was part of a pattern of recurring violence in that corridor.
Villages at Roll Hill was built as public housing in the 1960s and is now predominantly Section 8. Its median household income is approximately $11,327, and about 80% of family households live below the poverty line. The neighborhood recorded a double murder in February and a third killing in June.
The concentration of shootings in Millvale and Villages at Roll Hill is not random. Research dating back decades links isolated, concentrated poverty to higher rates of violent crime. The conditions those policy decisions created did not disappear when the policy changed. That history is part of what makes 2026’s numbers so difficult to bend. The Cincinnati Exchange will examine that connection in greater depth in a separate feature.
What Is Being Done About Cincinnati Crime?
Cincinnati has run summer safety plans for several years. Extra patrols, youth programming, community outreach, and CIRV’s focused deterrence strategy — targeting chronic violent offenders while connecting others to services — all continue in 2026. The juvenile crime picture adds another layer: as Signal 99’s analysis of juvenile crime in Cincinnati argued, unsupervised youth in high-poverty neighborhoods is a pipeline that enforcement alone cannot close.
Whether those efforts can flatten the current upward trend in non-fatal shootings is the central public safety question of this summer. The drop in fatal shootings suggests something is working somewhere in the system. The rise in non-fatal shootings suggests something else is not.
The data points in two different directions. Cincinnati is seeing more people shot but fewer people killed, and public policy has to account for both trends.
What to Watch
The CPD publishes weekly crime reports and maintains a live shooting dashboard through CincyInsights. The next meaningful data checkpoint will be the mid-summer numbers, typically released in late July or early August.
If the current pace holds through August — the months that historically produce Cincinnati’s highest levels of gun violence — the conversation around public safety this fall could look very different than it did just a year ago.
FAQs
Why are Cincinnati shootings increasing in 2026?
Current CPD data shows non-fatal shooting victims are up about 27% through early July. Officials point to a mix of seasonal violence, repeat offenders, and ongoing public safety challenges.
Are homicides increasing in Cincinnati?
No. While more people have been shot, gun deaths and overall homicides remain below the same point in 2025.
Which Cincinnati neighborhoods see the most shootings?
Neighborhoods such as the West End, Price Hill, Avondale, Millvale, and Villages at Roll Hill frequently account for a disproportionate share of shooting incidents, although violence can occur anywhere in the city.
Where does Cincinnati publish shooting statistics?
The Cincinnati Police Department releases weekly crime reports, and CincyInsights maintains a public dashboard tracking shootings and other crime trends.
Data drawn from CPD statistics, Local 12 reporting, and CincyInsights as of July 7, 2026. Figures are preliminary and subject to revision.
This article was developed with the assistance of artificial intelligence and reviewed, edited, and fact-checked by a human editor. The Cincinnati Exchange verifies all facts, data, and sources before publication and does not publish AI-generated content without human oversight.